WTI Crude to test $53 levels (Elliott Wave Analysis)
In my previous update " WTI Crude to surge going ahead", I had mentioned that " Expect prices to move down for short term at $44 per barrel followed by resumption of an uptrend which can push prices higher near till $53 per barrel".
WTI made a high of $48 before sinking to $40 on 13th November 2015. It tumbled to more than 8% on weekly basis. However, the bias continues to be positive as prices are moving in a sideways direction after surging from the bottom of $37 per barrel.
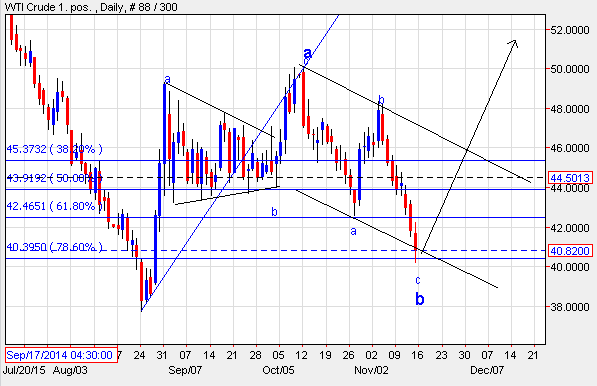
As per wave theory, from the bottom of $37.75 till $49.32 the wave structure was an impulse. At $49.32 wave a was completed followed by wave b which completed five waves in a triangle pattern and then wave c again in an impulse pattern. The following wave is wave x or wave b (if I mark the prior three waves as wave a on a higher degree) as it is coming down in a three wave structure. It has also retraced near to 80% of the previous rise indicating flat structure.
In short, the downside seems to be capped, expect prices to soar going ahead and test the level of $53 per barrel.
WTI Crude (Daily Chart)
Disclaimer: Please do not circulate this report to Clients and others. The motive for this short term update was to make aware of various patterns and its implications and how it can be used for forecasting various asset classes. Do not trade on this update or take any positions based on the above mentioned view


Comments