Posts

WTI Crude to test $53 levels (Elliott Wave Analysis)

Image
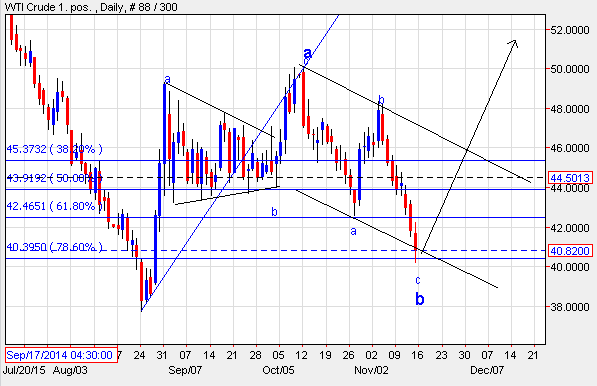
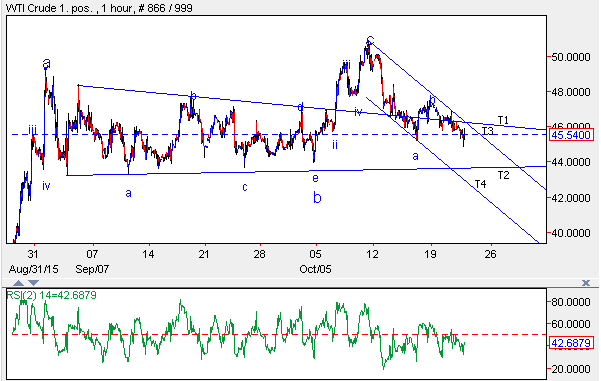
In my previous update " WTI Crude to surge going ahead", I had mentioned that " E xpect prices to move down for short term at $44 per barrel  followed by resumption of an uptrend which can push prices higher near till $53 per barrel". WTI made a high of $48 before sinking to $40 on 13th November 2015. It tumbled to more than 8% on weekly basis. However, the bias continues to be positive as prices are moving in a sideways direction after surging from the bottom of $37 per barrel. As per wave theory, from the bottom of $37.75 till $49.32 the wave structure was an  impulse. At $49.32 wave a was completed followed by wave b which completed five waves in a triangle pattern and then wave c again in an impulse pattern. The following wave is wave x or wave b (if I mark the prior three waves as wave a on a higher degree)  as it is coming down in a three wave structure. It has also retraced near to 80% of the previous rise indicating flat structure. In short, th

Gold: Anticipated happened and Elliott wave forecasting

Image
In my previous update " Gold in a complex correction pattern", I had mentioned that,    A decisive move below $1155 will open the possibility of $1076 on the downside with the resistance of $1230. Gold after breaching the level of  $1155 plunged and made a low of $1074 on 12th November 2015. The downfall was steep after hawkish comments by FED chair person Janet Yellen who gave a hint for a possible rate hike in mid December 2015, thus making Dollar strong and Gold weak. Gold is moving precisely in a falling channel, after facing the resistance of $1191, prices reversed and moved below its previous low of $1076, marking a low of $1074. The downfall was impulsive in nature as expected. As it is moving in wave Y where it is currently forming double correction (a-b-c-x-a-b-c). This double correction can be then converted into triple correction (a-b-c-x-a-b-c-x-a-b-c) or can terminate at $1074 levels. As of now one leg on upside is expected for gold now. In

Nifty to sink after the confirmation

Image
On 30th October 2015 Nifty broke the level of 8100 on closing basis which opens negative possibilities. In the previous update "Nifty on the brink to reverse", the level of 8200 followed by 8100 was crucial to give a confirmation on downside. As the index has reversed, the possibility for the prices to sink further is likely. As per wave theory, after completing expanding triangle pattern, prices moved sharply lower which is termed as the 'thrust' post triangle pattern, The downside is corrective in nature which can be plotted as a-b-c-x-a-b-c. This entire double correction can be one bigger correction as well. The larger formation will only be obtained as time passes by. In short, Nifty to move lower near till 7500 levels as the important supports are taken out. The downside target will only negate if prices move above 8300 levels. Nifty 60 mins chart Disclaimer : Please do not circulate this report to Clients and others. The motive for this short

Nifty on the brink to reverse

Image
Nifty is currently approaching near cluster of resistances which is long term downward sloping red trend line and 200 DMA placed at 8380 levels. As of now there is no reversal in this index, but the momentum on the upside seems to exhaust. A trend reversal will occur only if the level of 8200 is taken out followed by 8100 which is the previous lows. It is imperative for prices to reverse as it is moving precisely in a downward sloping red channel since the top was made at 9119 levels. At present it is hovering near the resistance of the red channel. However, there is no reversal on daily chart or any smaller time frame. On 60 mins chart, prices are moving in a positive direction by forming a higher highs and higher troughs. As of now it is quoting at the resistance of the upper trend line, it is also failing to cross it decisively from past three trading sessions (EOD) giving an indication there no vacuum on upside. An expanding triangle can also be seen on hourly chart. As

AUD/NZD: Impulse wave and reversal on Monthly chart

Image
After forming an ending diagonal in AUD/NZD on the monthly chart shown below from 2006 till mid of 2011, prices thereafter reversed and started moving in a negative direction breaking its previous troughs. In the month of April 2015 the pair made a low of 1.000 and reversed its direction. It gained for consecutive three months, crossing its previous high of 1.1304, thus opening positive possibilities. In the fifth month from the bottom, prices made a monthly high of 1.683 but failed to give a trend line break thus reversing its winning streak. Currently the pair is approaching near the channel breakout particularly known as throwback. As per wave theory, after completing an ending diagonal pattern, prices commenced downward journey in an impulse fashion. The last leg ended at 1.000 which is wave v. The current leg is corrective in nature which has three legs in it (a-b-c). As of now it is moving down in the form of wave b, and has retraced 61.8% of the previous up move. Break b

WTI Crude to surge going ahead

Image
On Wednesday eve OPEC members and non members meet was scheduled to discuss on risk to oil investments. The low oil prices is  risk as investments would hamper in new supplies. There was no out put cuts in the meet. Technically speaking, WTI crude oil prices are moving in a higher high and higher low formation after forming a low of $37.75. The current fall is just a reaction of main trend. As of no the trend is positive for Crude. As per wave analysis, from the bottom till $49.32 marked on 31st August 2015, the entire formation was an impulse wave, which is marked as wave a. The following wave was a sideways movement and was then formed as a triangle pattern, marked as wave b. After completing wave b, prices moved higher and formed wave c at $50.13 on October 12, 2015. The entire three wave structure can be marked as wave a of one higher degree or (a-b-c) pattern. The following down leg can be wave x or wave b of one larger degree. We will closely monitor the movement in Cru

Bank Nifty: In an Ending Diagonal pattern

Image
On 21st Oct 2015 major indices like Nifty, Bank Nifty and Sensex were highly volatile after the crash in Chinese market. It is always the structure that forms first followed by news/events (good/bad). In the previous update Nifty in an expanding triangle, upside seems to be capped was mentioned. In the below Daily chart of Bank Nifty it is clearly visible, that prices have discontinued the higher highs and higher troughs which is negative sign. RSI has also exhibited negative divergence which suggest that the momentum on the upside will exhaust soon. As per wave theory, after completing of wave a and wave b of one higher degree wave c was an ending diagonal. Ending diagonal (wedge) have five legs which is a motive wave. After completion of wave v, the post pattern impact was steeper dragging prices below the upward sloping trendline. In short, any move below 17430 will open negative possibilities for this index which can drag prices near till 15550 levels. Nifty daily