Posts

WTI Crude to surge going ahead

Image
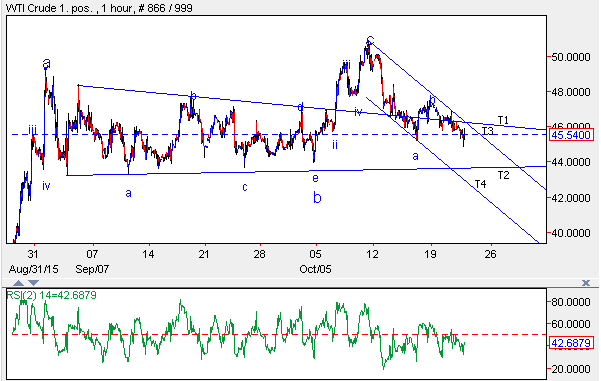
On Wednesday eve OPEC members and non members meet was scheduled to discuss on risk to oil investments. The low oil prices is  risk as investments would hamper in new supplies. There was no out put cuts in the meet. Technically speaking, WTI crude oil prices are moving in a higher high and higher low formation after forming a low of $37.75. The current fall is just a reaction of main trend. As of no the trend is positive for Crude. As per wave analysis, from the bottom till $49.32 marked on 31st August 2015, the entire formation was an impulse wave, which is marked as wave a. The following wave was a sideways movement and was then formed as a triangle pattern, marked as wave b. After completing wave b, prices moved higher and formed wave c at $50.13 on October 12, 2015. The entire three wave structure can be marked as wave a of one higher degree or (a-b-c) pattern. The following down leg can be wave x or wave b of one larger degree. We will closely monitor the movement in Cru

Bank Nifty: In an Ending Diagonal pattern

Image
On 21st Oct 2015 major indices like Nifty, Bank Nifty and Sensex were highly volatile after the crash in Chinese market. It is always the structure that forms first followed by news/events (good/bad). In the previous update Nifty in an expanding triangle, upside seems to be capped was mentioned. In the below Daily chart of Bank Nifty it is clearly visible, that prices have discontinued the higher highs and higher troughs which is negative sign. RSI has also exhibited negative divergence which suggest that the momentum on the upside will exhaust soon. As per wave theory, after completing of wave a and wave b of one higher degree wave c was an ending diagonal. Ending diagonal (wedge) have five legs which is a motive wave. After completion of wave v, the post pattern impact was steeper dragging prices below the upward sloping trendline. In short, any move below 17430 will open negative possibilities for this index which can drag prices near till 15550 levels. Nifty daily

Gold in a complex correction pattern.

Image
From the top of $1920 marked on 5th September 2011 prices failed to sustain at higher levels, eventually resulting in a crash. Currently it is trading at its three month high from the bottom of $1076 at $1176 per ounce, but it seems that this rally will fail going ahead.  Technically speaking, gold is moving in a negative direction forming a lower high and lower trough. Prices are also moving precisely in a downward sloping channel. The recent bounce have already retraced 50% of the previous fall, it can also retrace 61.8% placed at 1219 levels which is closer to the resistance of the channel . However, the momentum will fail to support prices which will mark a reversal. As per wave theory, prices are moving in a complex correction (W-X-Y) within which Wave W was a three wave pattern, wave X was a triangle and wave Y which is ongoing seems to be a double correction (a-b-c-x-a-b-c). Currently it is moving in wave c of wave b of the second correction in which it has completed t

Nifty in an expanding triangle pattern ( Elliott Wave Analysis)

Image
The recent bounce in Nifty was quite surprising for many traders especially after global markets were melting down on the back of speculation over rate hike by Fed and slow down in China. Nifty failed to move down further, finding support at the lower trend line placed at 7540 of the channel and marked a high of 8243 levels. Currently the rally seems to exhaust as it is moving in a expanding triangle pattern. A triangle has five legs, each are corrective in nature (3-3-3-3-3). Today it started its fifth leg which can move above 8243 or can even fail to cross it. A triangle at the top indicates that the rally is over, as the entire upmove itself is corrective in nature (w-x-y). Nifty needs to break the level of 8100 decisively for negative possibilities to open. The thrust of a triangle is always sharp and will retrace faster. The possibility for a trend reversal is likely in Nifty. In short, a trend reversal in Nifty is expected only if prices move below 8100 at much fast

USDINR: Neo Wave Diametric Pattern

Image
From May 2014 USDINR formed a diametric pattern which took seven months to complete. Diametric patterns are of two types Contracting and Expanding. In a diametric pattern there are seven legs (a-b-c-d-e-f-g) which are all corrective in nature. The first diametric in USDINR was expanding diametric, in a layman term, it is been termed as diamond pattern. The probability is much higher that the pair is forming another expanding diametric pattern which commenced from February 2015. Forecasting: The pair is moving in a double correction of diametric pattern, which can be labeled as (a-b-c-d-e-f-g-x-a-b-c-d-e-f-g). The first diametric shown in the chart (box) completed the last leg wave g at 62.20 levels followed by wave x which has three legs within (a-b-c). After completing wave x, the pair resumed its uptrend and plausibly started forming another diametric pattern. As per the wave counts it completed wave d in a three wave structure which is also the longest wave in the diametr

Bharti Airtel: Ending Diagonal Formation

Image
Bharti Airtel made a 52 week high of 435 levels but in last half an hour of trade the stock lost its shine and started moving lower. It closed at 425 levels after the weighted average.  There is a high possibility that the stock is moving in wedge pattern. The wedge pattern or ending diagonal pattern has five waves in it. In each five waves there are three waves which is corrective in nature (a-b-c), taking alteration into consideration. After the five waves are done it will reverse. In this case it is certain that Bharti has completed five waves and will possibly turn from hereon. On the lower side prices can moved down till 380 levels or even lower in near term or probably in June 2015 series. Bharti Airtel Daily Chart

DLF: Neo wave Diametric and 5th failure terminal

Image
Neo wave is the advance version of Elliott wave, the founder of this wave Glenn Neely has come out with additional patterns which were not in the major works of R. N Elliott. The contracting diametric and the 5th failure terminal pattern is found in DLF which is shown below. In a diametric formation there are two types one is contracting (bow and tie) and expanding. In this case we witness contracting formation which has seven legs (a-b-c-d-e-f-g). In the 5th failure terminal the third wave is the longest and the 5th wave fails to move above wave three. From the mid of 2013 DLF was forming a diametric formation and it completed wave g near 180 levels. Prices completed wave a of wave (a) at 180 levels. It then formed wave b of wave (a) near 140 levels, after that it rallied till 230 levels in the form of wave c of wave (a). Wave (b) was seems to be a complex correction and ended at 100 levels. Wave (c) was a 5th failure terminal and was completed at 165 levels. Currently it is movi