Posts

USDINR (3-3-5) Elliott Wave analysis

Image
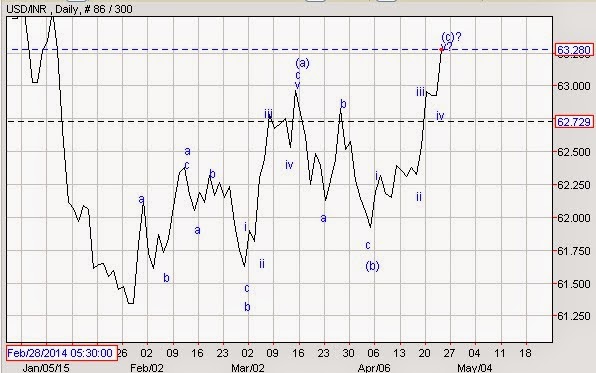
The pair moved up till 63.30 levels in today’s trading session, but it is important to see how wave counts are clearly visible on Daily charts. From the lows of February 2015, prices moved in a 3 wave structure and completed wave a of wave (a), followed by wave b at 61.50 of wave (a) and then wave c at 63.00 levels where it completed wave (a). Then it came down in a corrective fashion (a-b-c), where it completed wave (b). Currently it is moving up crossing the level of 63.00 levels in a 5 wave structure in which it is probably moving in a last wave i.e wave v of wave (c). Termination of this last leg of wave (c) will change the trend from positive to negative and can slip back down in near term. The next leg on the down side can be corrective or impulsive. It is imminent that prices will reverse and can test the level of 62.30-62.50 levels in coming month or so.

Will Gold give a surprise move?

Image
The recent demand pick up in Gold is undoubtedly due to escalating geopolitical concerns in Yemen. Gold which was trading near $1150 levels is now quoting above $1200 per ounce. The Fed meet last week stated that lift in interest rate will delay due to disappointing economic releases has actually helped Gold to gain strength as Dollar index tumbled till 96 levels. Yesterday Dollar index surged till 100 levels but there was no reversal seen in Gold, clearly indicating that the demand for safe haven still persists. As per wave analysis, the recent up move looks to be impulsive where it has completed wave i and wave ii. It is likely it will start its next leg which is wave iii soon pushing prices higher till $1240-1250 levels followed by wave iv on the downside and wave v which can test the level of $1280. An impulsive wave is very aggressive and completes one completes one larger degree at rapid pace. In short, the bias is positive for Gold and it is expected to test the le

German DAX heading for 13000? (Elliott Wave Forecasting)

Image
European Markets are at their historic highs and can surge further in near term as well. Germany which is the largest economy of Euro zone is quoting at 12300 levels. The recent lift in European indices was due to ECB who started their massive stimulus package to uplift the economy from the clouds of deflation. As per Elliott Wave principle, prices are moving in a positive direction as a corrective pattern (a-b-c). Currently it is moving in a wave c pattern which is an impluse pattern. In an impluse pattern is more aggressive on either side and has five wave in it. Not so soon it has completed wave (iv) on the downside and it is moving higher in the form of wave (v) of wave c which can test 13000 mark. In short as far as the level of 11800 is protected on downside the bias for German DAX is positive with the possibility for the levels of 13000. DAX daily chart

DJIA expected to test 18200?

Image
Dow Jones Industrial Average is quoting at 18000 levels after no clue given by FED as when to hike the interest rate. In the recent minutes released last week, many policymakers thinks that June is an appropriate month to lift the interest rate, but the inflation is a concern. The delay has actually helped the global markets to outperform. It is always better to be one step ahead of major turnings for investors and traders to catch the trend. Advance technical analysis such as Elliott Wave can probably help to identify the reversal. From the chart it is clear that prices are moving in a complex pattern and it is advisable to stick to the basics as well. The index is protecting its previous lows and crossing its previous pivot highs. In this case there is a possibility for prices to move in a sideways direction in a range of 17800-18200. It is likely that prices can test its previous high placed at 18200, as current up move is in the form of corrective pattern (a-b-c). The c wave can

Nifty to climb 9200-9300 levels?

Image
Nifty has corrected by almost 4.5% from its all time high of 9119 levels. The recent down move seems to have lost momentum and it seems that the major trend for the index which is undoubtedly positive will resume. Majority of the indicators are in oversold zone and it is difficult now to say what will be the next move from viewing the indicators. In the advance version of Elliott wave theory i.e Neo wave Prices are moving in a diametric pattern. Here in this case it is Bow and Tie Diametric Pattern. It has seven legs in it (a-b-c-d-e-f-g). All the legs in this pattern are corrective in nature. Currently it is moving in a wave f and it is on the brink to complete this leg on downside, thus opening the possibilities for the next leg on upside which will be wave g. This wave g will move above its previous high. In Nifty the previous high is 9119 levels, so if wave g has to cross its previous high which wave e it will surpass 9119 levels and can possibly move up till 9200-9300 le

Nifty to cross 9000 levels (Elliott Wave Analysis)

Image
In the month of January Nifty made all time high of 8996 levels missing marginally the psychological figure of 9000. Thereafter it corrected and made a low of 8470 levels, correcting almost 5%. The index surged from the lower levels and it is now quoting at 8833 levels. From the lows of 8470 prices continue to rise by making a higher high and higher low  and it has not breached its previous day low which clearly indicates that the trend is firmly positive. As per wave perspective, prices are moving in a corrective fashion (a-b-c). From the top of 8996 prices came down in (a-b-c) and it is now moving up in three wave structure, where it completed wave a at 8860 levels. Wave b is in barrier triangle formation which has 5 corrective waves in it (a-b-c-d-e). Probably prices have completed wave b in triangle formation and it is likely it will start moving up in the form of wave c which can test its previous highs or even cross it. In short, Nifty is expected to test 9000 levels in near

Bank Nifty to test 20900 levels (Elliott Wave Forecasting)

Image
From February 2014 till date Bank Nifty is moving in a rising channel formation which clearly indicates that the trend for this index is positive. A channel normally helps to identify support and resistance levels. Prices recently arrived near the support of the channel and has witnessed a bounce. As per wave theory, prices are moving in a triple corrective pattern (a-b-c-x-a-b-c-x-a-b-c). Recently it completed wave b at 18226 levels of the third correction and it is set to start the last leg that is wave c of the third correction. Wave b has also retraced 80% of wave a, which means it is forming a flat pattern. The third correction is a flat pattern, this indicates that wave c will touch the end of wave a or can exceed above it marginally. Thus the level of 20900 is imminent. In short, As far as Bank Nifty is moving in an upward sloping channel the bias remains positive and prices can test the level of 20900 in near term.