Nifty to cross 9000 levels (Elliott Wave Analysis)
In the month of January Nifty made all time high of 8996 levels missing marginally the psychological figure of 9000. Thereafter it corrected and made a low of 8470 levels, correcting almost 5%. The index surged from the lower levels and it is now quoting at 8833 levels. From the lows of 8470 prices continue to rise by making a higher high and higher low and it has not breached its previous day low which clearly indicates that the trend is firmly positive.
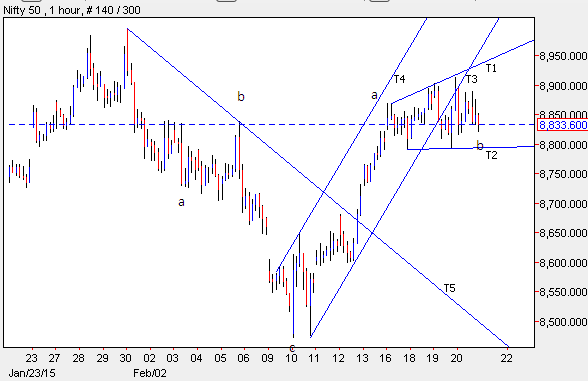
As per wave perspective, prices are moving in a corrective fashion (a-b-c). From the top of 8996 prices came down in (a-b-c) and it is now moving up in three wave structure, where it completed wave a at 8860 levels. Wave b is in barrier triangle formation which has 5 corrective waves in it (a-b-c-d-e). Probably prices have completed wave b in triangle formation and it is likely it will start moving up in the form of wave c which can test its previous highs or even cross it.
In short, Nifty is expected to test 9000 levels in near term as far as the level of 8750 is intact on downside.
Nifty 1 hour chart


Comments