Posts

Bank Nifty Anticipated Happened

Image
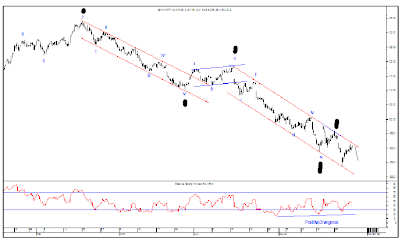
Bank Nifty was the only index who showed tremendous weakness from past 2 months, but is there still pain left in this index? The answer to the above question can be provided through advance technicals such as Elliott Wave analysis that gives us an objective answer. Combining Elliott wave along with simple technicals such as channels, retracements, projections helps us to understand the possible resistance and support levels. The following excerpt is been picked from our research report. Bank Nifty 120 mins chart (Anticipated on 2 nd September) Bank Nifty 120 mins chart (Anticipated Happened) Analysis: Bank Nifty is an index which includes banking stocks such as SBI, ICICI Bank, Axis Bank, HDFC Bank etc. As seen in daily chart, prices in May 2013 made a high of 13414 and thereafter it fell down steeply particularly from July 2013. Prices have arrived near the resistan

Maruti Suzuki: Elliott Wave Counts

Image
Maruti Suzuki was one of the underperformer stock in Auto sector, but is it still under performing? This can be understood with the help of Elliott wave counts which help us to identify the important reversals. Combining Elliott wave analysis and simple technicals such as Fibonacci retracement levels helps us to find out the possible target. Maruti Suzuki 60 mins chart Maruti Suzuki, Tata Motors, M&M, Bajaj Auto are Auto mobile stocks which comes under auto mobile sector. As shown in daily chart, Maruti made a high of 1774 in the month of May 2013 and thereafter it is moving down in a falling red channel. Currently prices are quoting at the support of the lower trend line, also RSI has exhibited positive divergence which opens positive possibilities. Now it is important to see a positive confirmation in this automobile stock which it gave today by moving up about 4.54%. From 60 mins chart, prices bounced from the lower end of the channel and gave a bullish

Different Triangle Patterns

Image
In Elliott Wave Principle, there are 4 types of Triangle Pattern 1.     Ascending Triangle 2.     Descending Triangle 3.     Symmetrical Triangle 4.     Expanded Triangle The above 4 triangles can be seen in a Bull market and Bear market. This can be seen in a below chart

Ambuja Cements: Predicting Through Gann Fan Anticipated Happened

Image
We had published an article saying that Ambuja Cements was one of the weakest cement stocks and can move down to 145-142 levels. We were almost accurate in mentioning the levels as the stock came down and made a low of 146.75 yesterday before the expiry of August series. In our previous article we used Gann Fan to derive the possible support for this cement stock and we had even showed it to our readers. Yesterday the stock fell steeply and took support of the 3x1 line which is a very crucial angle. This angle of 3x1 has its own importance as prices move very slowly once it starts moving above it. Find out the importance of other angles and how it can be used for trading perspective on 31 st August and 1 st September 2013. You can register yourself by writing to us on fivearcadvisory@gmail.com or you can call us on +91 022 23888933 You can also visit our official facebook page www.facebook.com/FiveArcAdvisory Ambuja Cement Anticipated on 21 st August 2013

Elliott Wave Principle

Image
We all know the importance of Technical Analysis and how it works in today’s market. Technical tools like channels, Fibonacci retracements and oscillators like RSI, MACD etc do give us signals for when to buy and sell. Combining simple technicals along with advance technicals like Elliott wave and Gann Analysis always keep us one step ahead of the market movement. Advance technical eradicate subjectivity and helps to take proper trading decisions. Today we shall see some important concepts of Elliott Wave theory. In 1920 R.N. Elliott invented this theory and named Elliott Wave. He observed that there are thirteen patterns or waves that recur in market price data and are repetitive in form, but are not necessarily repetitive in amplitude or time. We will now discuss some important concepts of Elliott wave theory R. N Elliott has discovered 2 types of waves in the market 1. Motive or Impulse wave 2. Corrective Wave 1. Motive or Impulse waves Elliott said that

Square of 9

Image
W.D Gann a legendary trader and an analyst has invented many master charts such as square of 144, hexagon, square of 52 etc, amongst these one was square of 9. We have discussed earlier about its origin, here we will be discussing the other concepts of this master chart. Square of 9 can be used in many ways and has different approach towards individual stocks, commodities and currenc y. We will first see how this master chart was constructed by William. D. Gann. Gann in early 1920’s visited India and there he saw a square within a circle. Thereafter he went to Egypt and saw pyramids based on these observations he constructed Square of 9. The chart has a square which is fit within a circle and there are numbers placed on the face of the square and outside the circle. At the center of the square we will place a starting number and then we will rotate with one increment at a time. One full rotation completes at number 9, and that explains the name of the chart. The numbers which are

Ambuja Cement: Predicting Through Gann Fan

Image
Ambuja Cements is one of the leaders in cement sector but from past 3 months the stock has disappointed many investors and traders. When the stock was trading at 210 levels in the month of July 2013 many investors thought that the stock will cross its previous high of 223 but it failed to do so and the reason was Holcim taking over Ambuja Cement. But does news drive the stock prices? We will see with the help of advance technical tool known as Gann Fan. Gann Fan was one of the inventions of William. D. Gann. He always believed that when a stock, commodity or currency price favors a particular angle then it will test angle above and vice-versa. Daily Chart: Ambuja Cement. Analysis In the late 2008 Ambuja Cement has started moving in a positive direction. The entire move from late 2008 to 2012, prices moved by forming higher high and higher low. Now in early month of this year prices started to move in a corrective manner. We have placed Gann Fan from la