Posts

EURINR Wave B in motion

Image
 EURINR daily chart Analysis EURINR is moving in a sideways direction with not clear trend. The sideways action has a broad range with support placed at 86.00 and resistance at 91.00 levels. Off lately prices have bounced from the level of 88.00 and has climbed back above 90.00 levels last week. The closing was below 90.00 but it seems that prices will re-conquer 90.00 levels in coming week. From Waves perspective, the pair is moving in wave B where wave A has taken 24 trading sessions and wave B has taken more than that, this confirms that prices are moving in a flat pattern (a-b-c). Currently prices are moving in wave B in which it is moving in wave c which is impulse. In wave c it has completed wave iii and wave iv which is still going on or is over. If it is completed than wave v on the higher side will start which can take prices near to 90.50 levels. The summation is EURINR has a significant support at 88.70, as far as it is protected on the downside, prices are expected to move

Nifty - Anticipated Happened

Image
 Nifty 4 hour chart anticipated on 10th June 2023 Nifty 4 hour chart happened on 16th June 2023 Analysis In my previous update I had mentioned that, " Nifty is positively poised and can move higher towards 18800-19100 levels over short to medium term." The benchmark made a high of 18863 levels which was anticipated range and it has not only crossed this but closed within the above mentioned range - Anticipated Happened. To view my previous update, click on the below mentioned link https://www.marketanalysiswithmeghmody.com/2023/06/nifty-and-5th-wave-extended.html As seen in the above chart, prices are moving in a higher highs and higher lows and in the wave v of wave v there is still room as five waves internally are not clear. This means that the uptrend will continue and prices will nearly reach towards 19100 levels which is the second resistance zone as per the Fibonacci projection. The summation is Nifty has still room to move higher and can test 18900-19100 price range g

Bank Nifty - Consolidation to persists

Image
 Bank Nifty 2 hour chart Analysis As seen in the above chart, I was of the opinion that the index can be forming expanding diagonal pattern but it seems that this will not be the case. The index is likely to take more time and consolidate in the range of 43400 on the lower side and 44200 on the higher side. The other possibility which I am opening here is that, as prices are moving in wave B there are high chances for the index to form triangle pattern at the top which will take time as it has completed wave a, wave b and currently moving higher in the form of wave c which can go till 44200-44300 price range. The summation is Bank Nifty can go higher from current levels but there can be dips coming in between which can drag prices near to 43700-43600 levels and then the index can soar towards 44200-44300 price zone. Join my Telegram Channel :  https://t.me/elliottician1 Join My Twitter handle :  https://twitter.com/meghmody? s=11&t=LtKvFYlMyQs71k-udwEPgQ

Gail Wave C to start?

Image
 GAIL daily chart Analysis As seen in the above chart, prices are moving in a sideways direction with the upper and the lower extremes well defined. On the higher side the stock has the cap placed at 114 levels and on the lower side the stock has support placed at 85 levels. Recently the stock has arrived near to the resistance and has reversed its trend facing the overhead supply, thereby opening negative possibilities. According to Wave theory, the stock has subdivisions and completed wave a at 83.50 levels followed by wave b in a flat pattern and has started wave c lower where wave i of wave c is over and currently it is moving in wave ii of wave c where it can reach near to 110-111 levels and then falter towards 95 levels in the form of wave iii. The summation is GAIL can be sold near to 110-111 levels as it can falter towards 95-98 price zone over short term. Join my Telegram Channel :  https://t.me/elliottician1 Join My Twitter handle :  https://twitter.com/meghmody? s=11&t=L

ICICI Bank Complex Correction

Image
 ICICI Bank 4 hour chart Analysis As seen in the above chart, prices were consolidating in a descending triangle pattern which was broken on the lower side thereby giving a bearish breakout. Prices then tried to move higher and re-test the pattern trend line but not closed within the pattern. MACD is exhibiting sell signal and it is also below the center line. From Waves perspective, the banking stock is moving in a complex correction where it completed wave W at 797 levels followed by wave X at 959 levels and wave Z is in motion where the first correction has started in which wave a and wave b is over and wave c on the downside is pending which can drag prices near to 920 levels followed by 910. The summation is ICICI bank is negatively poised and can move down near to 920 levels followed by 910 over short term. Join my Telegram Channel :  https://t.me/elliottician1 Join My Twitter handle :  https://twitter.com/meghmody? s=11&t=LtKvFYlMyQs71k-udwEPgQ

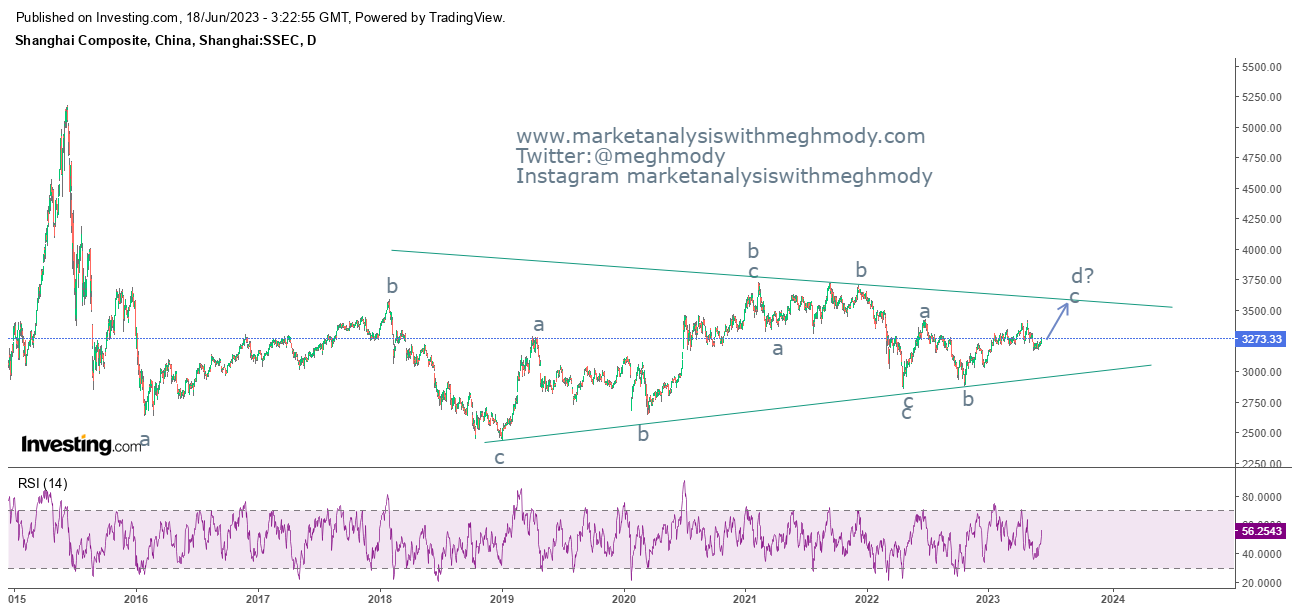
Shanghai Composite Index (SCI)

Image
 Shanghai Composite Index daily chart Analysis From the above daily chart, prices are moving in a sideways direction with no trending or directional move. However, the extremes of the range are well defined which is the upper and lower trend line and looks to be that the index is forming a bigger triangle pattern. As per Wave theory, prices might be moving in a symmetrical triangle pattern where it has completed wave c and it is currently moving in wave d where wave a and wave b of wave d is over and wave c of wave d is in motion which can move towards 3500-3550 levels over short term. The summation is Shanghai Composite Index can test 3500-3550 levels over short term as it is positively poised. Join my Telegram Channel :  https://t.me/elliottician1 Join My Twitter handle :  https://twitter.com/meghmody? s=11&t=LtKvFYlMyQs71k-udwEPgQ

Silver and Elliott Wave Analysis

Image
Comex Silver daily chart Analysis As seen in the above chart, prices after making a high of $26.46 levels have started showing signs of correction. The bullion seems to have made a top and can correct. However, the counter correction can also extend for some time. This is the similar case of counter correction where prices are expected to move higher from current levels towards $24.60-$25.00 levels. From Waves perspective, prices are moving in a counter correction which is wave b where wave a is over and wave b is in motion, within wave b prices have completed wave a and wave b and wave c of wave b is still pending which can test the above mentioned level. The summation is Comex Silver is positively poised and can move higher towards $24.60-$25.00 levels going ahead. Join my Telegram Channel :  https://t.me/elliottician1 Join My Twitter handle :  https://twitter.com/meghmody? s=11&t=LtKvFYlMyQs71k-udwEPgQ