Nifty Elliott Wave Analysis
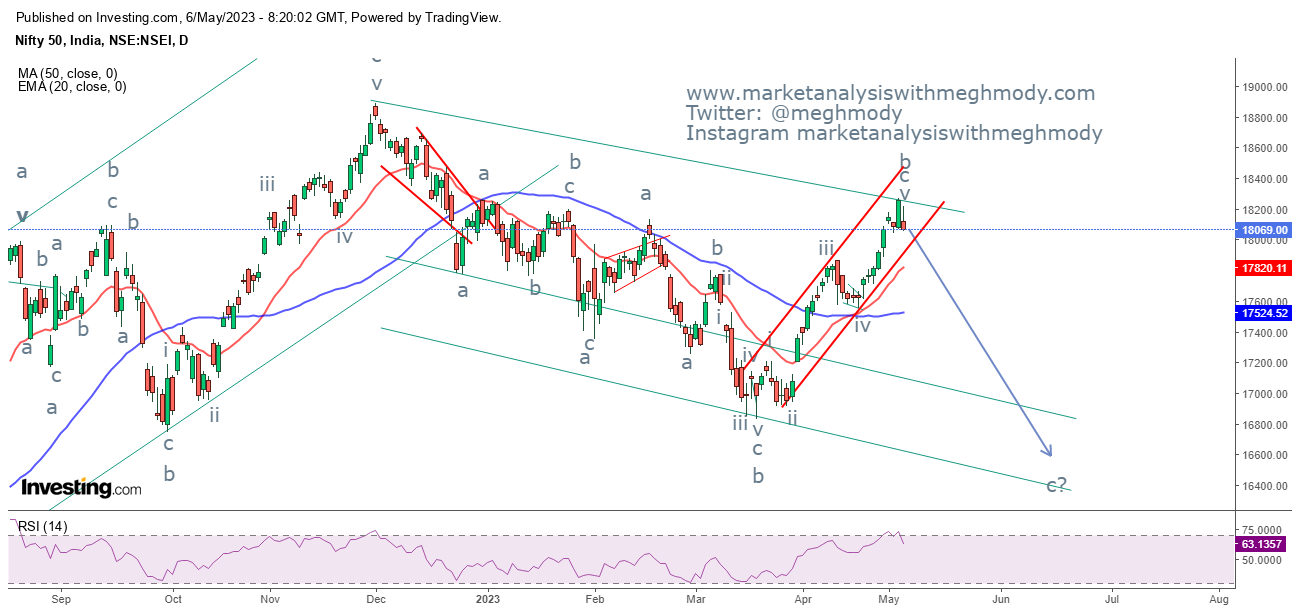
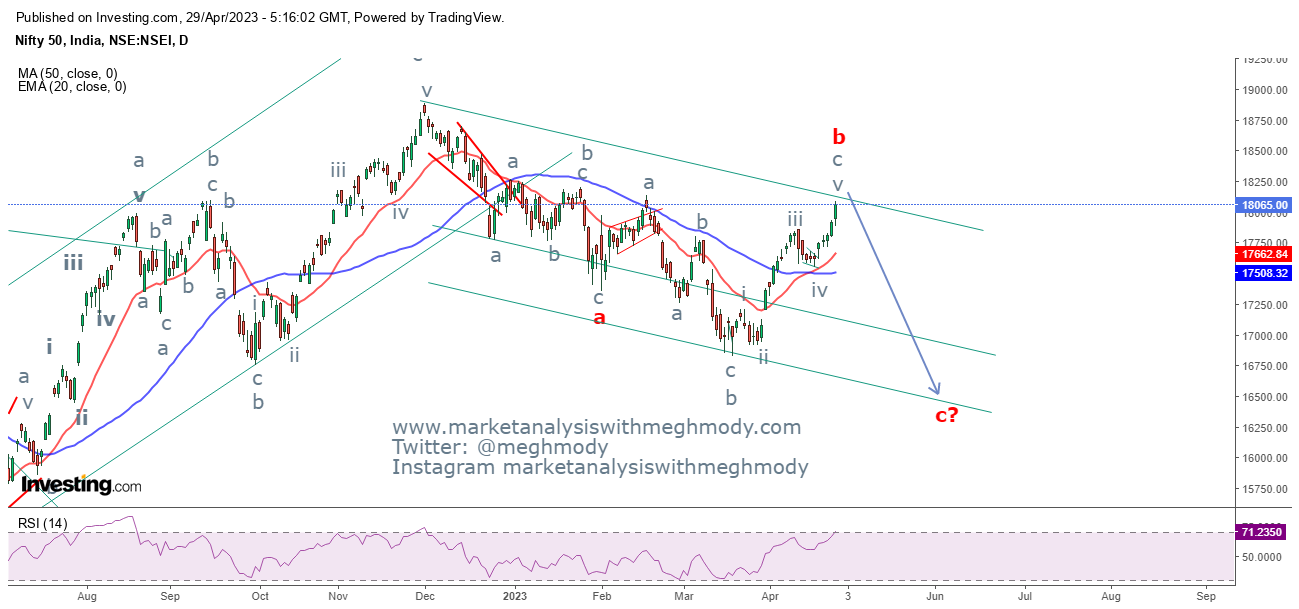
Nifty daily chart Nifty 2 hour chart Analysis As seen in the above chart, the index made a high of 18267 and closed near to the high on Thursday. However, the benchmark could not sustain higher started shedding all the gains it made during the week on following day. The reversal which came on Friday was very aggressive as sellers were in action. This also opens the possibility of a reversal. In my previous update I was of the opinion that there can be a 100-130 points rally which will be short lived. Any reversal from these levels will open negative possibilities. In the weekly chart the index has formed shooting star (candle stick pattern) opening negative possibilities. Negative possibilities seems to have opened but trend reversal is still pending. For any reversal to happen there needs to be a price confirmation which can only happen when there is a discontinuation of the positive trend or negative pattern break. For Nifty to reverse it is imperative for it to break the level of