Posts

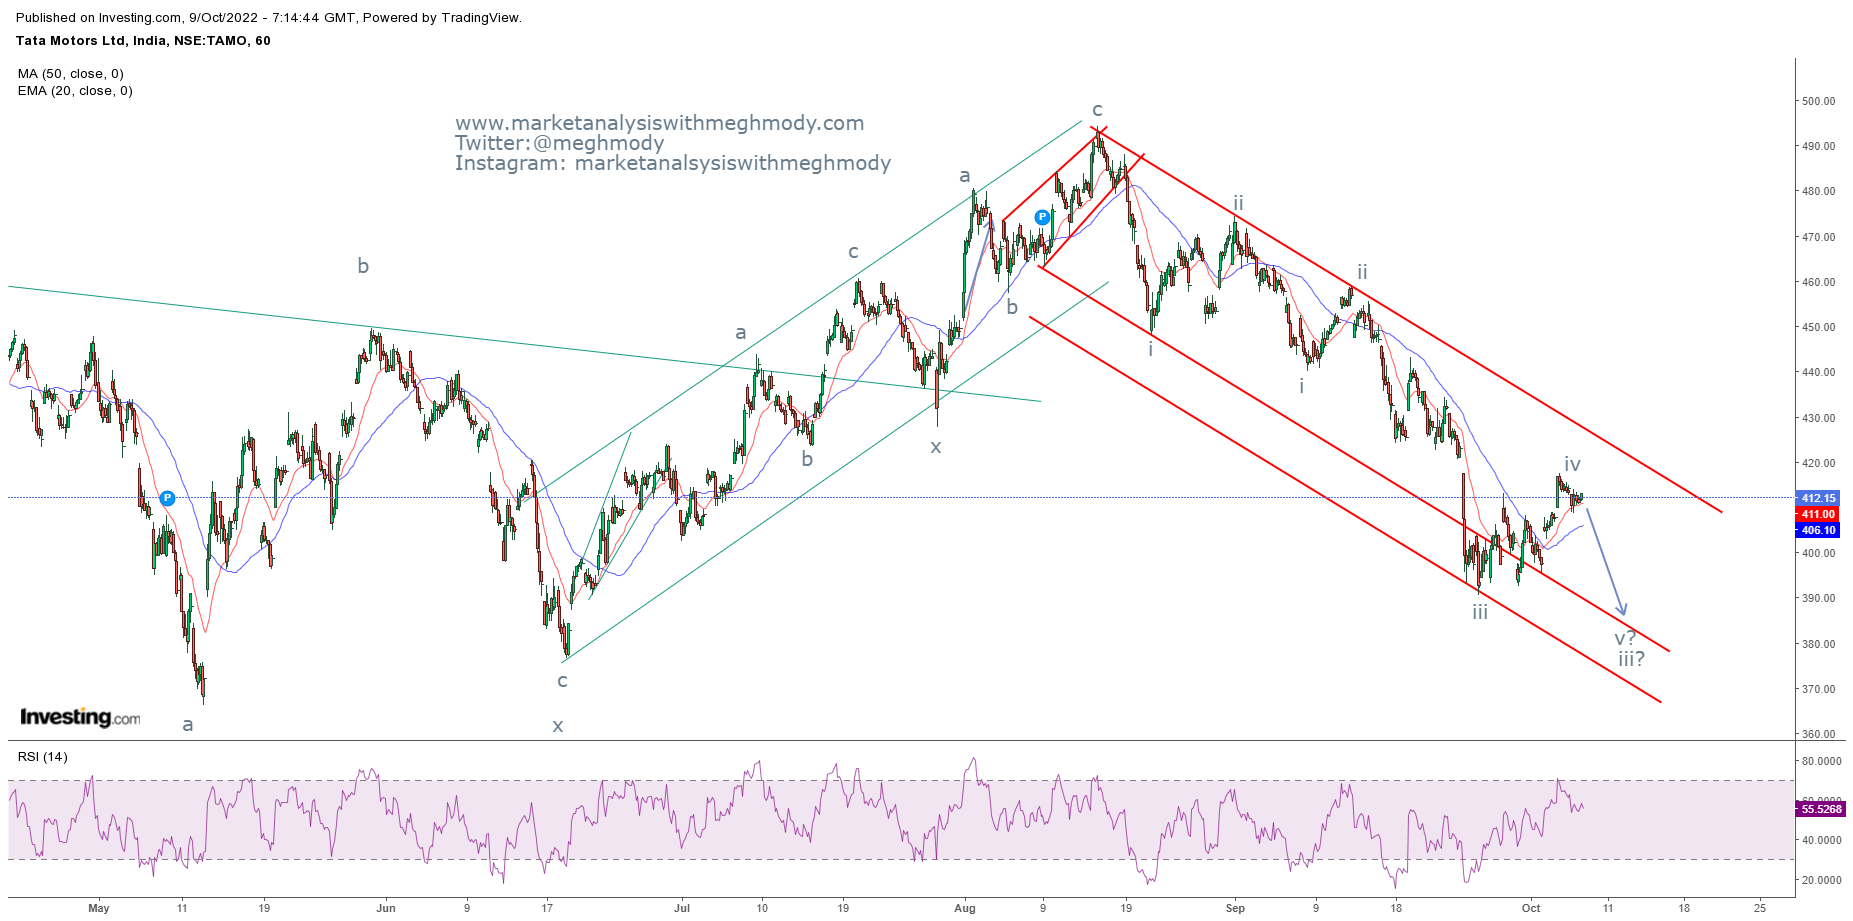
Axis Bank Elliott Wave Analysis

Image
 Axis Bank 1 hour chart Analysis As seen in the above chart, prices which were moving above the falling trend line has now re-entered that line and is now acting as a resistance too (role reversal). RSI has reversed from the overbought zone giving an indication that the upside isn’t sustainable. However, the moving averages are showing positive crossover, but due to their laggard behavior it can again give a bearish crossover as time passes by. Wave theory suggest that the preceding upside wave was wave x and now it has started wave a in which it has completed wave a and wave b and will unfold wave c lower which can test the level of 660-640 levels. The summation is Axis bank is firmly negative and can test the level of 660-640 zone over short to medium term with resistance placed at 770 (closing basis).

Tata Motors Elliott Wave Analysis

Image
 Tata Motors hourly chart Analysis From the above chart, it is very clear that the trend of this auto stock is negative and can continue to dip going ahead. With prices moving in a lower highs and lower lows, there is a possibility that the stock can plunge from current levels. The RSI has exactly reversed from the overbought terrain and it is set to change the direction. As per Wave Analysis, prices are moving in impulse fashion, where it recently completed wave iv of wave iii and it is now set to start wave v of wave iii which can sink towards 385 levels. This leg will complete wave iii on one larger degree. The summation is Tata Motors is negatively poised and can test the levels of 385 over short term.

Bitcoin Elliott Wave Analysis

Image
 Bitcoin 4 hour chart Analysis From the above chart, the crypto continues to trade below the falling red trend line which gives an indication that the trend is firmly negative. However, it seems that the trend will change or it is in the process to change. The price confirmation can only be obtained once the red falling trend line is crossed and it is sustained above it, this will open positive possibilities. Another indicator is RSI which is exhibiting positive divergence, giving an indication that the downside is minimum from current levels. As far as Elliott Wave counts, prices are moving in wave v and in wave v it is forming ending diagonal. Recently it completed wave iv of wave v near the resistance and reversed. Now it is moving down to form wave v of wave v. The summation is Bitcoin can dip towards $17800-17600 levels over short term.

Etheruem Elliott Wave Analysis

Image
 Ethereum 4 hour chart Analysis As shown in the above chart prices are moving precisely in a falling red channel giving an indication that the trend is negative. Prices are also on the brink to give a breakout in a symmetrical triangle pattern which will give further direction to the price after sideways consolidation. As per wave theory, prices are moving in wave c where it has completed wave iv in a triangle pattern and will start wave v lower. The summation is Ethereum can slump towards $1220-1200 over short period of time.

MCX Aluminum Elliott Wave Analysis

Image
 MCX Aluminum hourly continuous chart Analysis From the above chart, MCX Aluminum has given a bullish break in a falling channel which is a positive sign and also an indication that the trend is on the brink to change from negative to positive. After crossing the resistance prices then started moving lower and it is now set to test the support of Fibonacci. I think aluminum price can test the support of 50% of Fibonacci from (186.5-211.35) which is placed at 199 levels. The CMP is 204 and it can slip towards 199 or close to it. As per wave theory, prices moved up in an impulse fashion and is now moving down and it looks corrective. I think wave c has started on the downside or wave a is over then wave b higher and then wave c back down. Two probabilities are here to stay. The summation is MCX Aluminum can test the level of 199 over short term.

FTSE 100 Elliott Wave Analysis

Image
 FTSE 100 daily chart Analysis As shown in the above chart, FTSE 100 is an index of UK and looking at the chart one can easily interpret that the direction of the index is negative. Firstly the index broke the rising trend line followed by triangle pattern which was broken recently, thereafter there was re-testing of the pattern, thus opening the possibility for prices to slump. The volumes play important role in any pattern breakout, when the symmetrical pattern was broken (downside) there was a rise in volumes which gives the validity of the pattern. From Waves perspective, after complex correction (w-x-y) there was a symmetrical pattern formation happening at the top finally completing wave y. After completing the pattern, prices are moving in a impulse fashion where it is on the brink to complete wave iv and then wave v on the downside is pending. The summation is FTSE 100 is all set to plunge towards 6500 levels over short to medium term.

Nifty Elliott Wave Anlysis

Image
 Nifty daily chart Nifty 2 hour chart Analysis Last week, Nifty again achieved my level of 17200-17000 which was mentioned in my previous update. I had also mentioned that 200 SMA will give support to the index, the benchmark moved below the 200 SMA but closed above it. From daily chart, the index has given a bearish crossover of the two moving averages which I have been using 20 EMA (red) and 50 SMA (blue). This crossover (bearish) has happened after July 2022, indicating that the trend of the market is weak. Prices are also facing the resistance of the gap down placed at 17200-17300 levels. Daily ADX is above 20, once it is above 25-30, Nifty can sink towards 15800 levels over medium term. In 2 hour chart, the benchmark is moving in a lower highs and lower lows and moving precisely in the falling red channel. Prices recently bounced from the lower end of the channel and crossed the level of 17000. Nifty will faced the resistance of 17200-17300 levels which will activate sellers