Tata Motors Elliott Wave Analysis
Tata Motors hourly chart
Analysis
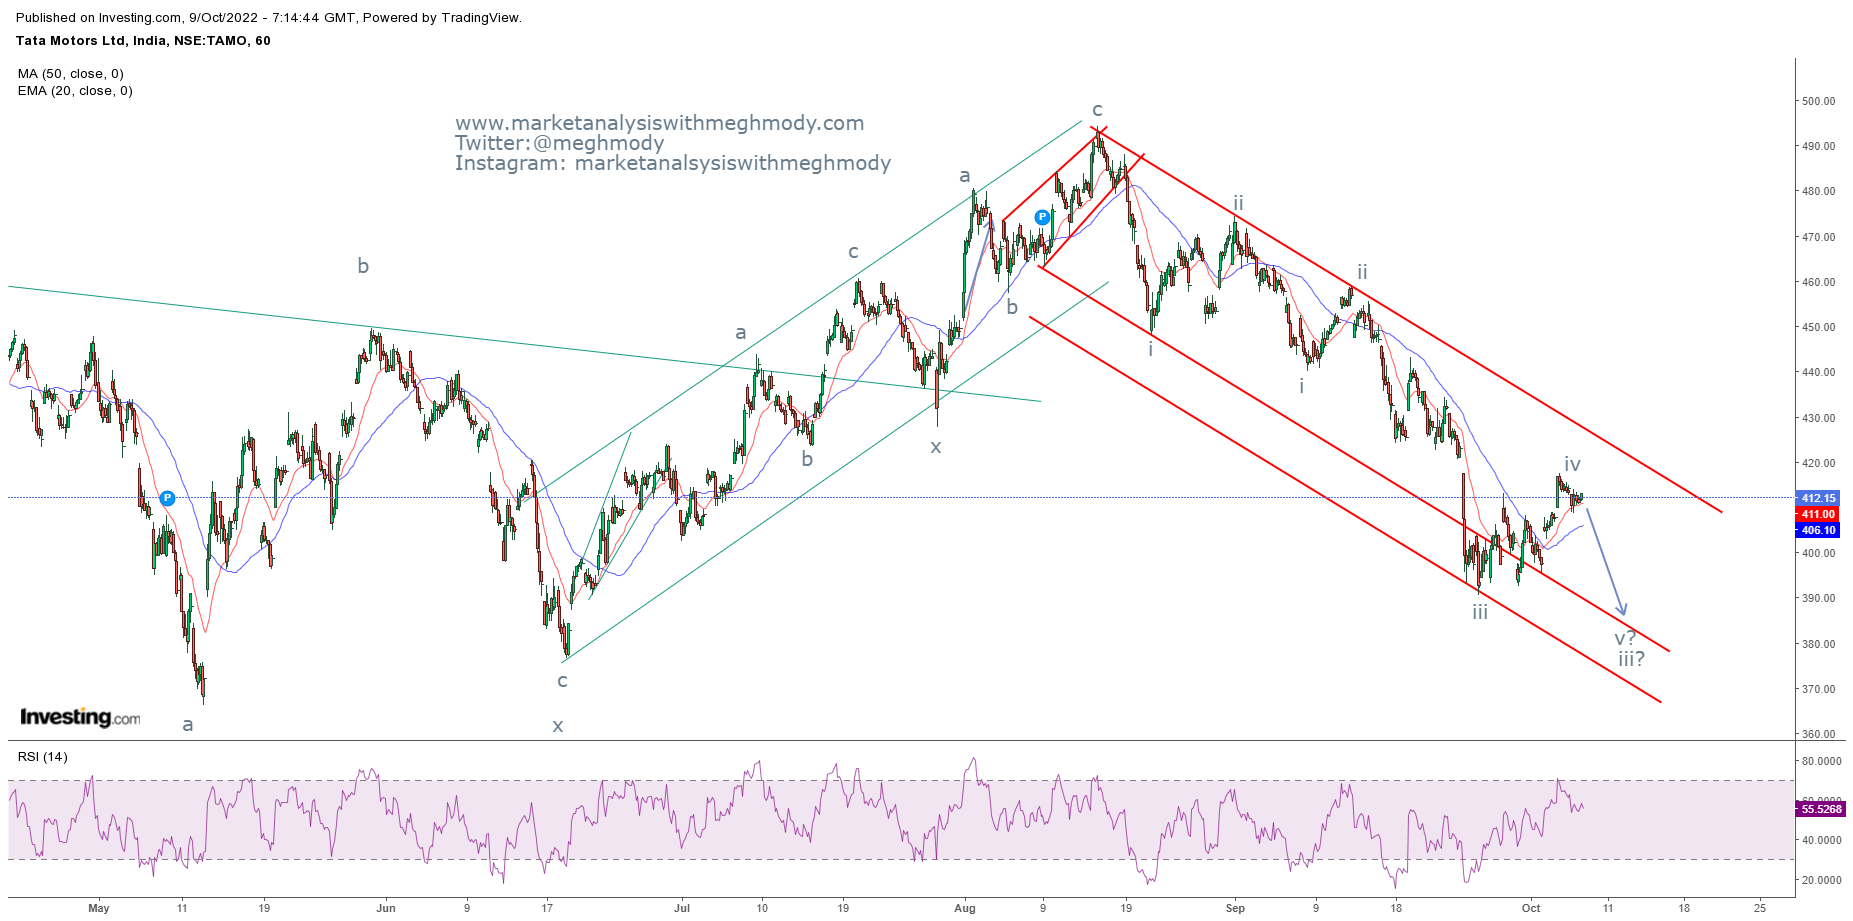
From the above
chart, it is very clear that the trend of this auto stock is negative and can
continue to dip going ahead. With prices moving in a lower highs and lower
lows, there is a possibility that the stock can plunge from current levels.
The RSI has exactly
reversed from the overbought terrain and it is set to change the direction.
As per Wave Analysis,
prices are moving in impulse fashion, where it recently completed wave iv of
wave iii and it is now set to start wave v of wave iii which can sink towards
385 levels. This leg will complete wave iii on one larger degree.
The summation
is Tata Motors is negatively poised and can test the levels of 385 over short
term.


Comments