Posts

MCX Silver Anticipated Happened and Elliott Wave Analysis

Image
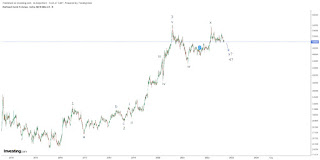
 MCX Silver daily continuous chart anticipated on 15th March 2022 MCX Silver daily continuous chart happened on 1st September 2022 In my previous update on 15th March, I had mentioned that Silver is  poised to falter till 50000 levels over short to medium term. The bullion after completing the pattern has tumbled till 51551 levels. When I wrote this article in the month of March the CMP of Silver was at 68000. - Anticipated Happened Here is the link of my previous article on MCX Silver, click on the below link to read https://www.marketanalysiswithmeghmody.com/2022/03/mcx-silver-symmetrical-triangle.html As per Wave theory, Silver prices can dip further and even break the level of 50000 levels and test 48000 levels over short term. As prices have completed wave i and wave ii is on the brink to complete, wave iii can break its previous low going ahead. The summation is MCX Silver is negatively poised and can test 48000 over short to medium term.

Dow Jones DJIA Elliott Wave Analysis

Image
Dow Jones DJIA 1 hour chart Analysis As shown in the above chart, prices are moving in a lower highs and lower lows formation and it is precisely moving in a falling channel, indicating that the trend of the index is weak and it is set to plunge going ahead. MACD has given a sell signal and it continues to remain in the negative terrain which is a negative sign for the benchmark. From Waves perspective, prices are moving either in complex correction (w-x-y-x-z) which looks to be difficult to accept or in (A-B-C) pattern. After completing wave B, prices have started wave c lower in which it has completed wave i and wave ii and has recently opened wave iii which will be violent in nature. The summation is Dow Jones is set to plunge at least till 28500-28400 levels over short term.  

MCX Gold and Elliott Wave Analysis

Image
 MCX Gold daily continuous chart The yellow metal has shown immense strength over past 6 years. However, this year due to rate hike concerns Gold has shed most of the yearly gains of 2022. The rate hike is going to stay here for some time as far as inflation remains at 4 decades high. FED will ensure it comes close to their target of 2% which is not possible at least for a year to come. Elliott wave suggests that prices have completed wave 3 around 60000 mark and there by in complex correction prices are moving in wave 4. Currently prices are moving down in wave y of wave 4 and can test 48000 or go even lower going ahead.

MCX Copper Elliott Wave Analysis

Image
 MCX Copper 60 mins chart From the above chart, prices are moving in a higher highs and higher lows which is a positive formation and it is precisely moving in a rising channel. The red metal has a strong support of 660 which is least likely to be tested. Copper has formed bullish cup and handle pattern at the bottom and has given a bullish break, thus opening positive possibilities. The target of the pattern is 718 which can be achieved over medium term. Over short term it can test 695-698 price range. RSI has also relieved from the overbought and it is ready to move back up. Wave theory suggest, prices are moving in impulse fashion where it has completed wave i and wave ii. In wave iii of wave iii is extended in which it will start wave v higher, thus completing wave iii. The summation is MCX Copper is expected to soar till 695-698 price range over short period of time.

MCX Natural Gas Elliott Wave Analysis

Image
  MCX   Natural Gas has rallied till 760 levels and thereby it has started moving in a lower highs and lower lows formation. At present the energy segment has shown some resilience which has opened doors for it to test its previous high. From  2  hour  chart,  prices  after breaking the falling channel has shown strength, it is likely that prices are expected to test the level of 670 over short term. RSI is well above the center line which is a positive sign. As per Wave theory,  the fall from 760 looks impulsive and so I have marked it as wave a which was completed at 602 levels. After that it is moving in form of wave b where wave a of wave b and wave b of wave b is completed. It has just unfolded wave c of wave b. The summation is MCX  Natural Gas is likely to test the level of 670 with support at 627 (closing basis) .

Nifty Midcap 100 and Elliott Wave Analysis

Image
 Nifty Midcap 100 2 hour chart. Nifty Midcap has gained 9.12% in line with Nifty Bank which has also gained 9.94% from the recent bottom made in the month of June 2022. As shown in the above daily chart, the index has shown tremendous strength and it will continue to surge as the trade setup looks lucrative. The entire fall from the significant top of 2021, prices are moving in a lower highs and lower lows. Recently, in a small rising channel the index is showing some strength. This indicates that the index can move near till its previous pivot high placed at 28500 levels. RSI is inching towards the overbought terrain. From 1 hour chart, the index is moving in a higher highs and higher lows and precisely in a rising channel. Recently it is bounced from the support of the channel and has also crossed series of resistances (black horizontal line). Keltner channel which moves well in a trending market, the index has closed above the upper channel indicating a fresh buy signal. RSI sti

MCX Natural Gas: Inverse Head and Shoulder Pattern and Elliott Wave Analysis

Image
 MCX Natural Gas 2 hour continuous chart MCX Natural gas after forming a distribution pattern particularly rising wedge tumbled near about 420 levels. A sideways consolidation was seen in this energy sector, making it as a bullish reversal pattern. From 2 hour chart, prices were moving in a falling channel which was breached thus opening positive possibilities. It was then turned into bullish head and shoulder pattern which was broken on the last trading day of the previous week, which opens further positive possibilities. MFI is in positive terrain and can move towards the overbought terrain. As per Wave theory, prices have completed wave a in a complex correction (a-b-c-x-a-b-c) and has started wave b higher which can move towards 620-650 levels. One can initiate buying of 500 CE which is trading at 66 with target of 105 Stop loss placed at 37. The summation is MCX Natural Gas is positively poised and can move higher towards 620-650 levels with support at 511 (closing basis).