Posts

MCX Aluminum: Stealth Bear trend and Elliott Wave Analysis

Image
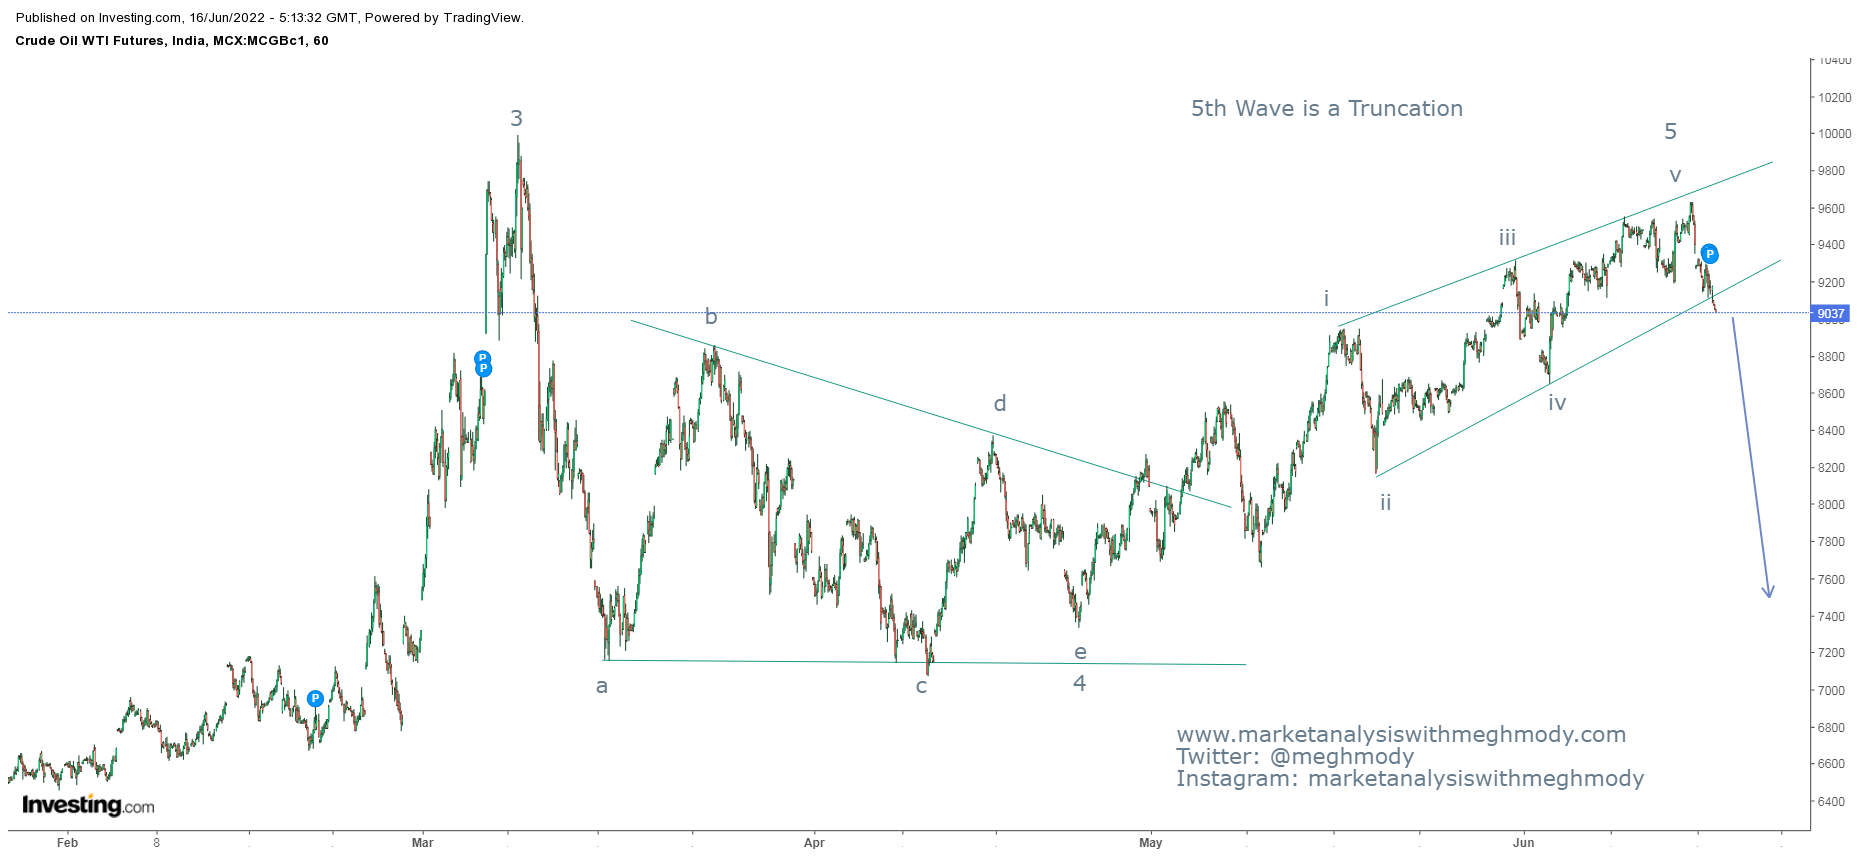
 MCX Aluminum 2 hour continuous chart As seen in the above chart, it is very clear that pries are in stealth bear trend. The metal price continues to move in a lower highs and lower lows and moving precisely in a falling channel. Recently prices were moving in a stiff range of 214-206 levels which was broken last week and has bounced back after making a low of 202. Currently prices are moving higher to test the level of 206, which when done will resume the major trend. RSI has also relieved from the oversold terrain. As per wave theory, prices completed wave iv in a symmetrical triangle pattern and has opened wave v on the downside. This wave can move down towards 195 levels.   The summation is MCX Aluminium is firmly negative as it has a crucial resistance placed at 206 levels. The metal can sink towards 195 levels as far as 209.3 is intact on the upside (closing basis).

MCX Crude Oil Anticipated Happened

Image
 MCX Crude Oil 60 mins chart anticipated on 16th June 2022 MCX Crude Oil 60 mins chart happened on 6th July 2022 In my previous update dated on 16th June I had mentioned that, " MCX Crude Oil is set to sink till 7500 INR followed by 5000 INR over short to medium term." MCX Crude plunged till 7535 levels thereby achieving my short term target of 7500. I had anticipated the fall from 9037 thus gaining 16.62%- Anticipated happened. To view my previous article, click on the below link https://www.marketanalysiswithmeghmody.com/2022/06/mcx-crude-oil-and-5th-wave-truncation.html   Now since my short term target is achieved, I will now look the next waves and how it unfolds to possibly meet my medium term target of 5000.

Ethereum: Elliott Wave Analysis

Image
 ETH 4 hour chart From the above chart, prices are consolidating above its recent low and it seems it will falter as the inverse head and shoulder pattern is negated. This opens negative possibilities as prices can test its lows back again. As far as Elliott Wave counts, as far as equality is in place, it is difficult for the price to move back down and break its previous low. It can retest and then move higher. Wave 5 of one higher degree cannot be in corrective mode either but since it is wave i of wave 5 it can be leading diagonal or ending diagonal in wave 5 itself. For this to be intact it need not break the low of $880 levels. The summation is Ethereum can dip near about $980-$930 over short term which can form a basing formation for this crypto. However, break of $880 will accelerate further selling pressure

Bitcoin: Elliott Wave Analysis

Image
 Bitcoin 4 hour chart As seen in the above chart, prices faced the resistance of the middle trend line of the falling channel and reversed, this now opens the possibility of testing $17,000 levels again. Please understand, none of the previous highs are taken out and also it is precisely moving in a falling channel. For a reversal, prices need to break the falling channel and give a bullish break. Wave theory suggests, Bitcoin is moving in the last wave and in v wave (v) is ongoing. This wave can be in equality of wave (i) of wave v which comes to $16,800 levels. So I think prices can falter towards $17,000-$16,800 to complete wave (v) 0f wave v of wave c. The summation is Bitcoin has failed to give resilience as expected and has shown signs of reversal which can drag prices in a range of $17,000-$16,800 levels.

Nifty Bank: Elliott Wave Analysis

Image
 Nifty Bank daily chart Nifty Bank 2 hour chart Nifty Bank has opened with a gap up in the start of the week and later it shed all its gains making it move in a sideways to negative territory. Just like Nifty, it remained above the neckline of the bullish reversal pattern and closed above it. This indicates the relevance and the validity of the inverse head and shoulder pattern. As shown in the above daily chart, prices are still moving in a lower highs and lower lows which is a negative sign. It is important for the index to break the falling trend line which will open fresh positive possibilities. Daily ADX is signaling that the preceding downtrend has no strength left as it is quoting at 13.81. This indicates that no intense fall in the index can be seen at least for some trading days and a relief rally is a possible. From 2 hour chart, the index tested the neckline multiple times and it bounced from the support of the neckline which was earlier acting as a resistance (role reve

Nifty: Elliott Wave Analysis

Image
 Nifty daily chart Nifty 2 hour chart Nifty last week has consolidated in the range of 15700-15800 levels, only on the last day of the trading week, it came close to my stop loss of 15500 levels but failed to trigger it. In my previous report I had opened the possibility of re-testing the neckline of an inverse head and shoulder pattern. The benchmark exactly tested or tried to test the neckline and reversed in the second half of Friday’s trading, back in the buying range of 15700-15800 levels. From daily chart, the index filled all the pending gaps down and closed in a positive terrain, thus forming a long legged candle indicating that the bulls have the upper hand. Last 4 trading sessions prices consolidated in a stiff range but ROC continues to exhibit positive sign, staying well above the center line. Also the benchmark is facing resistance of 20 EMA (red), it is imperative for prices to move above this moving average which can then open the resistance of 50 SMA (blue) placed at

MCX Gold: Neo Wave Diametric Pattern

Image
 MCX Gold 60 mins continuous chart From the above chart, prices are moving in a sideways direction and it is important that there is a trending move in either direction. Gold and Dollar Index moves in opposite direction. With strengthening in Dollar Index, gold will lose its shine. The short to medium term is negative as it is moving in a lower high and lower lows and precisely in falling channel. Currently the yellow metal is hovering near the resistance of the falling trend line and it is important for price to reverse from current juncture. As per Wave theory, prices have completed wave a in complex correction and currently it is moving in wave b in diametric pattern. Once wave b is over wave c on the lower side will start which can drag prices till 49500-49200 levels. The summation is MCX Gold is negatively poised and can falter near till 49500-49200 levels over short term.