Posts

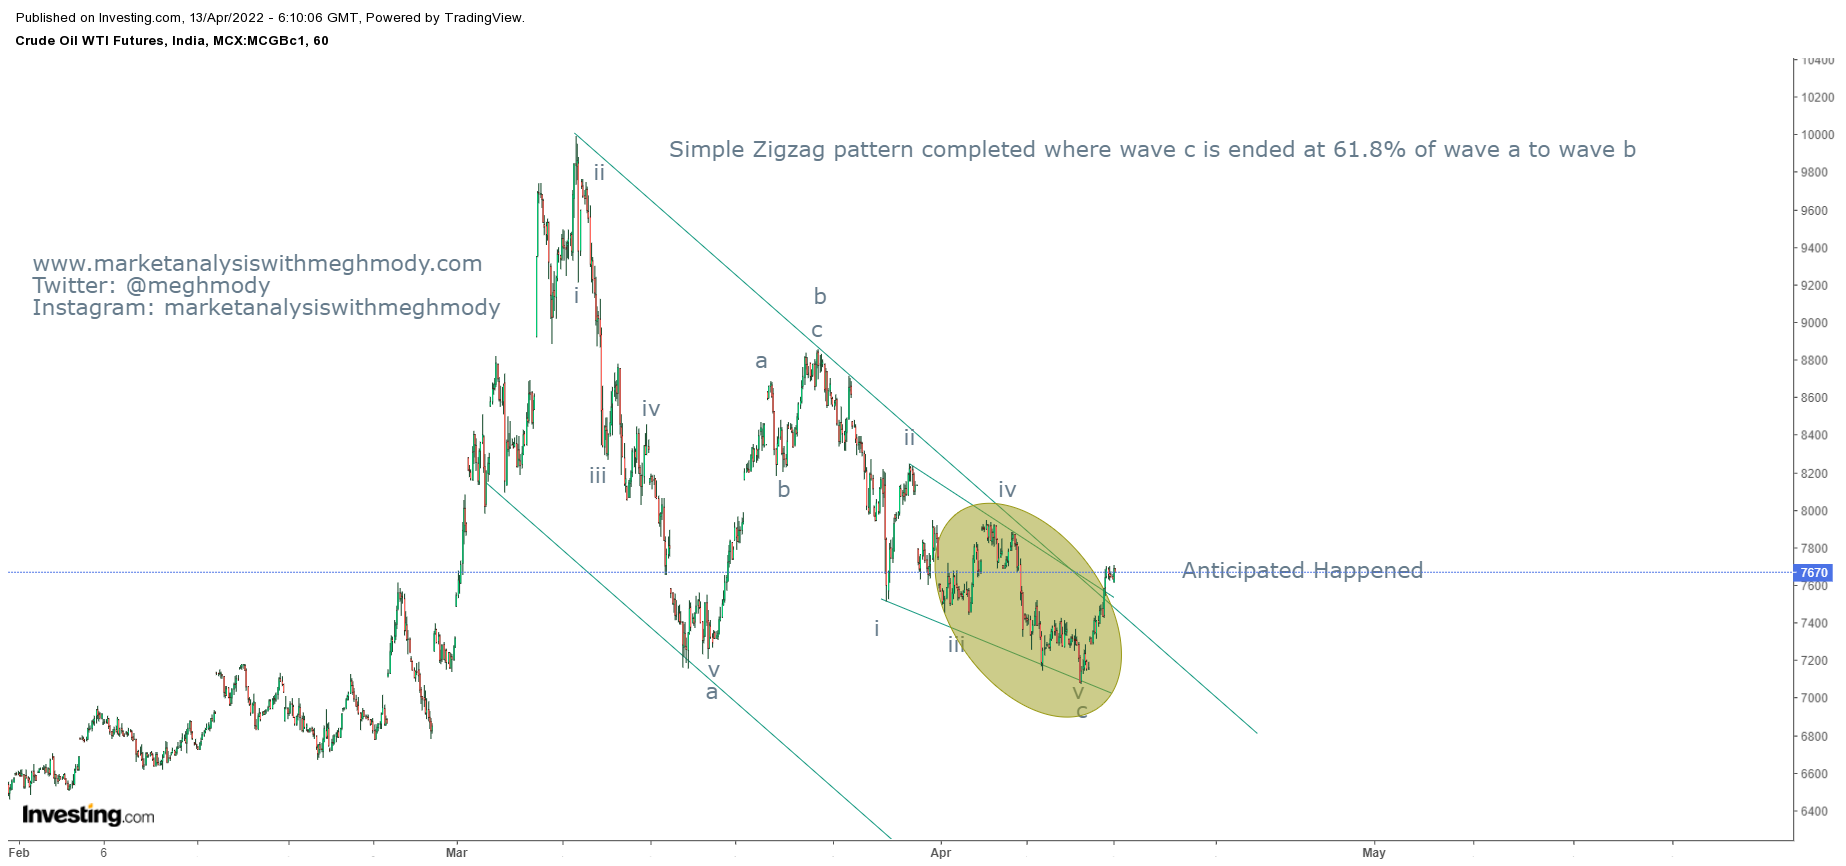
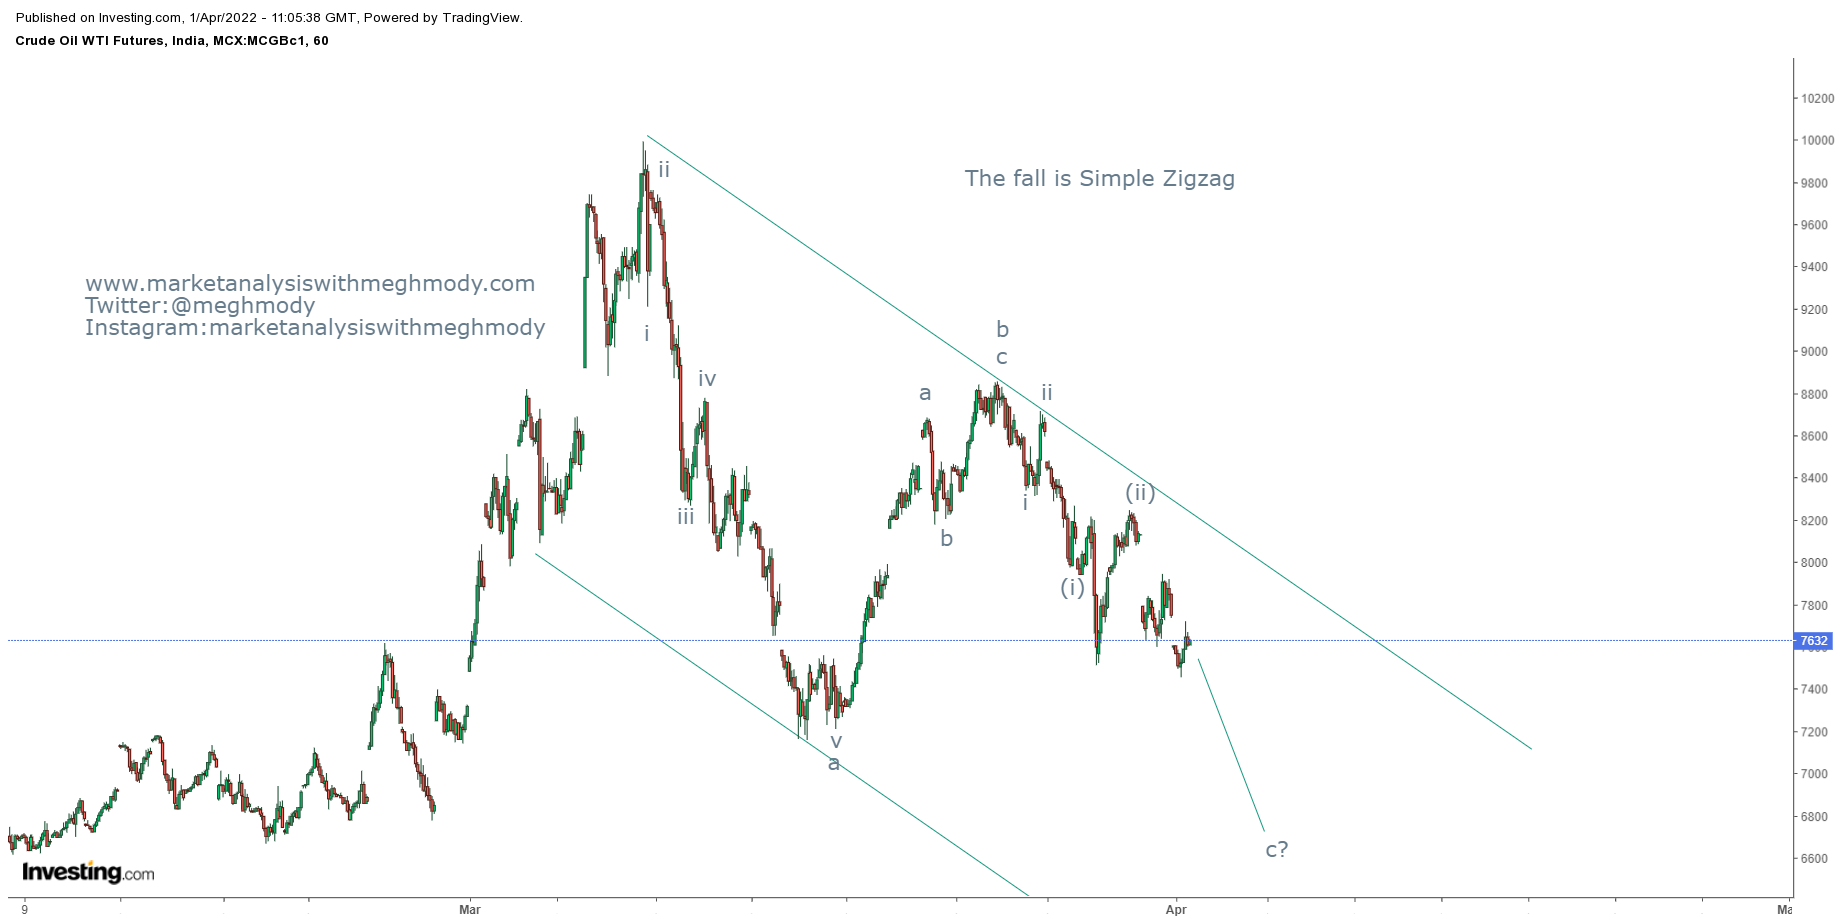
MCX Crude Oil: Elliott Wave 5th Wave

Image
 MCX Crude Oil daily chart MCX Crude Oil is all set to rise again and can also move above its previous high as higher highs and higher lowers are intact. Secondly the shift in the angle has changed which can be verifies as it has broken the rising channel on the higher side. RSI has also relieved from the over bought terrain which is a positive sign. As per Wave Theory, prices have completed wave 4 in simple zigzag and it has started moving higher in the form of wave 5 of an impulse. Wave 1 was extended, wave 2 has not even moved below 38.2% of wave 1. Wave 3 is not 100% of wave 1 which opens the possibility that wave 3 will be shorter than wave 3. In this case, 5th wave can move up till 10000 -10200 levels over short term. The summation is MCX Crude Oil is positively poised and can move till 10,000-10,200 levels over short term

MCX Crude Oil: Revisited

Image
MCX Crude Oil 60 mins chart anticipated on 13th April 2022 MCX Crude Oil 60 mins chart happened on 14th April 2022 In my previous update on MCX Crude Oil I had mentioned that, " MCX Crude Oil is set to soar near till 7950-8000 levels over short term."  Prices after giving a bullish break continued to soar and achieved my mentioned level of 7950-8000 levels on following day - Anticipated Happened I had following the MCX Crude Oil chart and applied Elliott Wave on it and was highly successful in anticipating the fall along with the rise. To view my articles on MCX Crude Oil, click on the below link MCX Crude Oil Anticipated Happened https://www.marketanalysiswithmeghmody.com/2022/04/mcx-crude-anticipated-happened.html MCX Crude Oil: Simple Zigzag pattern https://www.marketanalysiswithmeghmody.com/2022/04/mcx-crude-oil-simple-zigzag-elliott.html As now the trend for the black gold is firmly positive, I will continue to monitor the prices of crude oil to understand if it is impul

MCX Crude: Anticipated Happened

Image
 MCX Crude Oil 60 mins chart anticipated on 1st April 2022 MCX Crude Oil 60 mins chart happened on 11th April 2022 In my previous update on MCX Crude Oil, I had mentioned that, " MCX Crude Oil can test the level of 7155 followed by 6620 levels over short term." I had given two targets in MCX Crude where the first one was achieved as it made a low of 7071 which was 61.8% of wave a to wave b. The second target was 161.8% of wave a to wave b where zigzags can be completed which it did not - Anticipated Happened To view my previous article on MCX Crude Oil, you can click on the below link https://www.marketanalysiswithmeghmody.com/2022/04/mcx-crude-oil-simple-zigzag-elliott.html Prices plunged by over 7.30% in 7 trading sessions and then bounced from cluster of supports breaking the falling trend line resistance and also the falling wedge pattern, both indicates that downtrend is over. As per wave theory, prices have completed wave a wave b and wave c in an ending diagonal patter

Tata Steel: Elliott Wave Analysis

Image
 Tata Steel 60 mins chart As shown in the above chart, prices are moving in a lower highs and lower lows and it is moving precisely in the falling channel. At current juncture, the stock is hovering near to the resistance of the falling channel and has also formed a rising wedge pattern.  From Waves perspective, prices have completed wave b and has unfolded wave c lower. In wave b, wave c of wave b is ending diagonal which was broken on 11th April 2022. As of now it is moving back up to test the resistance of the pattern. This concludes than wave c has started and can move down to test 1070 levels where cluster of supports are placed. The summation is Tata Steel is negatively poised and can plunge near till 1070 levels over short term.

Bank Nifty: Anticipated Happened and a reversal on cards?

Image
 Nifty Bank 60 mins chart anticipated on 2nd April 2022 Nifty Bank 60 mins chart happened on 3rd April 2022 In my previous update I had mentioned that, " Nifty Bank will continue to move higher close to 37500-37650 levels over very short term." To view my previous article on Nifty Bank click on the below link https://www.marketanalysiswithmeghmody.com/2022/04/bank-nifty-anticipated-happened-and.html The index crossed my level and also moved above the trend line resistance but failed to sustain above it, thus re-entering the falling channel. This opens negative possibilities for the the index. At present it is holding the trend line support, break of this level will infuse selling pressure and can drag prices way to lower. From waves perspective, prices have completed wave x  and will start double correction in this index (a-b-c-x-a-b-c). After completion of wave x, the index has started wave a which can move close to wave c of first correction. I am not in a rush to give bigg

Nifty: Anticipated Happened and road ahead with Elliott Wave

Image
 Nifty 60 mins chart anticipated on 9th March 2022 Nifty 60 mins chart happened on 4th April 2022 In my previous update I had mentioned that, "  I will continue to be positive for Nifty and it can move higher till 17600-17800 levels over short term." Nifty closed well above 18000 mark which has achieved my level of 17600-17800 levels - Anticipated Happened To view my previous article on Nifty, click on the below link https://www.marketanalysiswithmeghmody.com/2022/03/nifty-neo-wave-neutral-triangle-and.html Nifty has arrived near cluster of resistance marked by arrows also it is moving precisely in the rising channel which is steeper. This entire up move looks to be corrective but I am also opening  impulse wave as well, only a move above 18160 will open further positive possibilities. However, I still think that it will reverse from current levels and complete wave x. The summation is Nifty is set to reverse only a move below 17700 is broken which will infuse selling pressur

Bank Nifty: Anticipated Happened and Elliott Wave Analysis

Image
 Bank Nifty hourly chart anticipated on 9th March 2022 Bank Nifty hourly chart happened on 1st April 2022 In my previous update on Bank Nifty, I had mentioned, " Nifty Bank is positively poised and can move higher from current levels towards 37000-37300 over short term." On 1st April Nifty Bank made a high close to 37200 levels thereby achieving my above mentioned range/level - Anticipated Happened To view my previous article on Bank Nifty, click on the link below https://www.marketanalysiswithmeghmody.com/2022/03/bank-nifty-neo-wave-extracting-triangle.html The index after giving a bullish break in a small falling channel, it started moving higher in a higher highs and higher lows and also arriving near to crucial resistance of the big falling channel. I think prices can move tad higher from here to test the resistance zone. As per Wave theory, prices are moving in wave x, there is a high possibility prices will move close to 37500-37650 levels over very short term which wil