Posts

MCX Crude Oil: Simple Zigzag Elliott Wave Analysis

Image
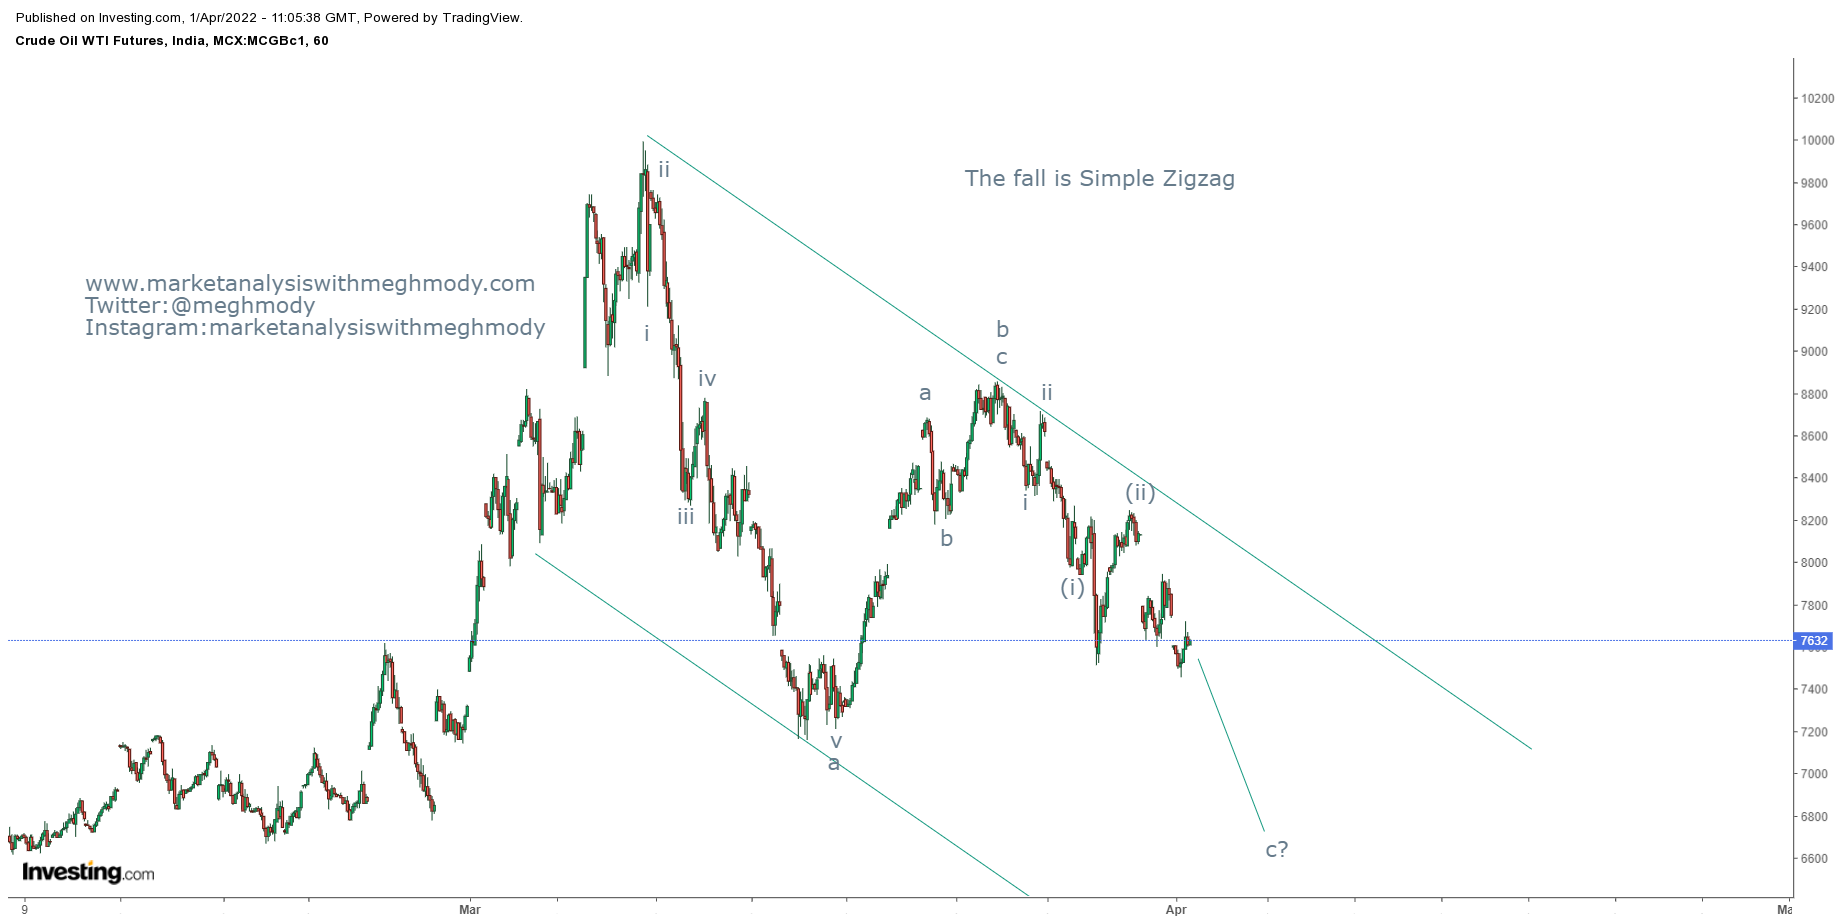
 MCX Crude Oil 60 mins chart Prices after moving up till 9990 levels on the back of ongoing conflict between Russia and Ukraine has now shown a relief. It looks like a major top is in place and the Crude Oil is set to plunge going ahead. As of now, prices failed to cross its previous high which discontinues higher highs. It is imperative to see if prices break its previous low.  Wave theory suggests, the commodity is moving in a simple zigzag pattern, where wave a is impulse followed by wave b which ended just below 61.8% and no wave c which looks to be impulse and can end up in between 61.8-161.8% of wave a to wave b. The summation is MCX Crude Oil can test the level of 7155 followed by 6620 levels over short term.

IDFC First: Elliott Wave Analysis

Image
 IDFC First 60 mins chart As shown in the above chart, prices are moving precisely in a falling channel and will continue to persists in this channel indicating that the trend will continue to be negative. Also the stock is moving in a lower highs and lower lows which support the above analysis. From Waves perspective, the stock is on the brink to complete wave C of a one corrective pattern (A-B-C). In wave C, the tricky part is whether it is completed or it is still ongoing as there is extension within extension seen. I have come up with the analysis that prices might re-test 36-35 odd levels in the form of last leg of wave C and then it will reverse (the above chart is self explanatory). The summation is IDFC First bank will face resistance at 42-3 levels forcing prices to re-test 36-35 levels over short term.

MCX Copper: Elliott Wave Analysis

Image
 MCX Copper continuous 60 mins chart From the above chart, MCX Copper is moving in a sideways direction, with the range becoming narrower going ahead. With this scenario one can possibly open triangle pattern. There is also another pattern in making which is bullish cup and handle pattern. The pattern will only be completed once it decisively breaks the level of 840. As per Elliott Wave, prices are either moving in wave ii or wave b at present. If the metal forms a triangle pattern then it will be clear that wave b has formed and wave c on the upside is pending. To form triangle, it will take time.  The other possibility is, prices will reverse and break 840 levels from here which will complete wave ii lower in the form of (w-x-y). In both the scenarios, the red metal is set to move higher, particularly above 840. The summation is MCX Copper needs to break 840 on the upside which can infuse additional buying soaring prices till 870-880 levels.

Bitcoin Revisited Part II

Image
 Bitcoin daily chart As shown in the daily chart, BTC has been moving as per my analysis. I must tell all my readers that from the month of January 2022, I am in a view that Bitcoin will test $75000 this year (2022). To add, last year in the month of July 2021, I had predicted the reversal in this crypto and was successful. This year am expecting reversal. I have written many BTC articles, click on the link to see view the articles Bitcoin Elliott Wave Analysis https://www.marketanalysiswithmeghmody.com/2022/01/bitcoin-elliott-wave-analysis.html Bitcoin Revisited https://www.marketanalysiswithmeghmody.com/2022/01/bitcoin-revisited.html Bitcoin Elliott Wave and Neo Wave Analysis https://www.marketanalysiswithmeghmody.com/2021/08/bitcoin-elliott-wave-and-neo-wave.html As per Elliott Wave, I think wave y is finally over in the form of triangle. This completion has already opened the possibility of moving prices to a new high and to my above mentioned target. The summation is BTC is very p

Nifty Media: Elliott Wave Impulse

Image
 Nifty Media daily chart The index has formed a tremendous foundation at the bottom and from there it started forming higher highs and higher lows which is a positive sign. At present it is precisely moving in a rising channel and has bounced from the channel support. At the lower end of the chart, a bullish reversal pattern is completed. This pattern is bullish cup and handle pattern. The target of the pattern comes to 2900 levels.  From Waves perspective, prices are moving in an impulse fashion where recently it has completed wave iv just on the neckline where it was previously facing the resistance earlier. Now it is moving higher in form of wave v, this wave can exhaust at 2600 mark which is 61.8% from wave i to wave iv or can extend till 100% of wave i = wave iii = wave v which is placed at 2900-3000 levels. The summation is Nifty Media index is positively poised and can move in a positive direction till 2600, a sustainable move above 2600 will open further positive possibilities

Ethereum: Elliott Wave Impulse

Image
 ETH daily chart As shown in the above chart, the trend is firmly positive as prices continue to protect its previous lows. Also the crypto is looking very strong to march north going ahead this year. From waves perspective, prices are moving in a impulse fashion from Dec 2018 till date. Here, ETH has completed wave 1 to wave 4 and it is all set to start wave 5 higher. This wave 5 can move towards $6000-$6100 levels over medium term. The summation is, ETH is positively poised and can move higher near till $6000-$6100 levels over medium term.

EURINR: Possibility of Reversal with Elliott Wave Analysis

Image
 EURINR spot 60 mins chart anticipated on 21st Feb 2022 EURINR spot 60 mins chart happened 7th Mar 2022 From my previous update in EURINR, I had mentioned that, " EURINR is negatively poised and can test the level of 81 over short term." Prices faltered till 83.5 and is showing signs of reversal which indicates that it wont sink further but will move up. I have made a serious attempt for the pair to tumble which it did to a certain extent. To view my previous article on EURINR, click on the below mentioned link https://www.marketanalysiswithmeghmody.com/2022/02/eurinr-elliott-wave-analysis_21.html As per wave analysis, I think prices have completed wave a at one higher degree and now wave b has started which can go up from current levels.  The summation is EURINR is all set to reverse and can reach a level of 85-85.3 levels over short term.