Posts

MCX Crude Oil: Elliott Wave Analysis

Image
 MCX Crude Oil daily continuous chart From the above daily chart, it is crystal clear that prices are moving in a higher highs and higher lows and are all set to move higher as per the traditional technical analysis. However, it is difficult to know that how much high it can go from current levels if you do not know the advance technical analysis. As shown in the chart, prices has found support near its preceding low marked by (4)/ (horizontal line) and from there it is showing sighs of reversal. A candle stick has also formed a long legged, indicating buying at lower levels. As per Wave theory, prices have completed 5 impulse waves starting from level where it went below 0 (price). It took almost one and the half year to complete one impulse cycle and now it has started corrective pattern where it completed wave a and it is all set to soar in form of wave b. The summation is MCX Crude Oil is all set to test the level of 5700-5800 over short to medium term as far as 5000 levels are pro
USDINR : Change of trend (Part2) and Elliott Wave Analysis

Image
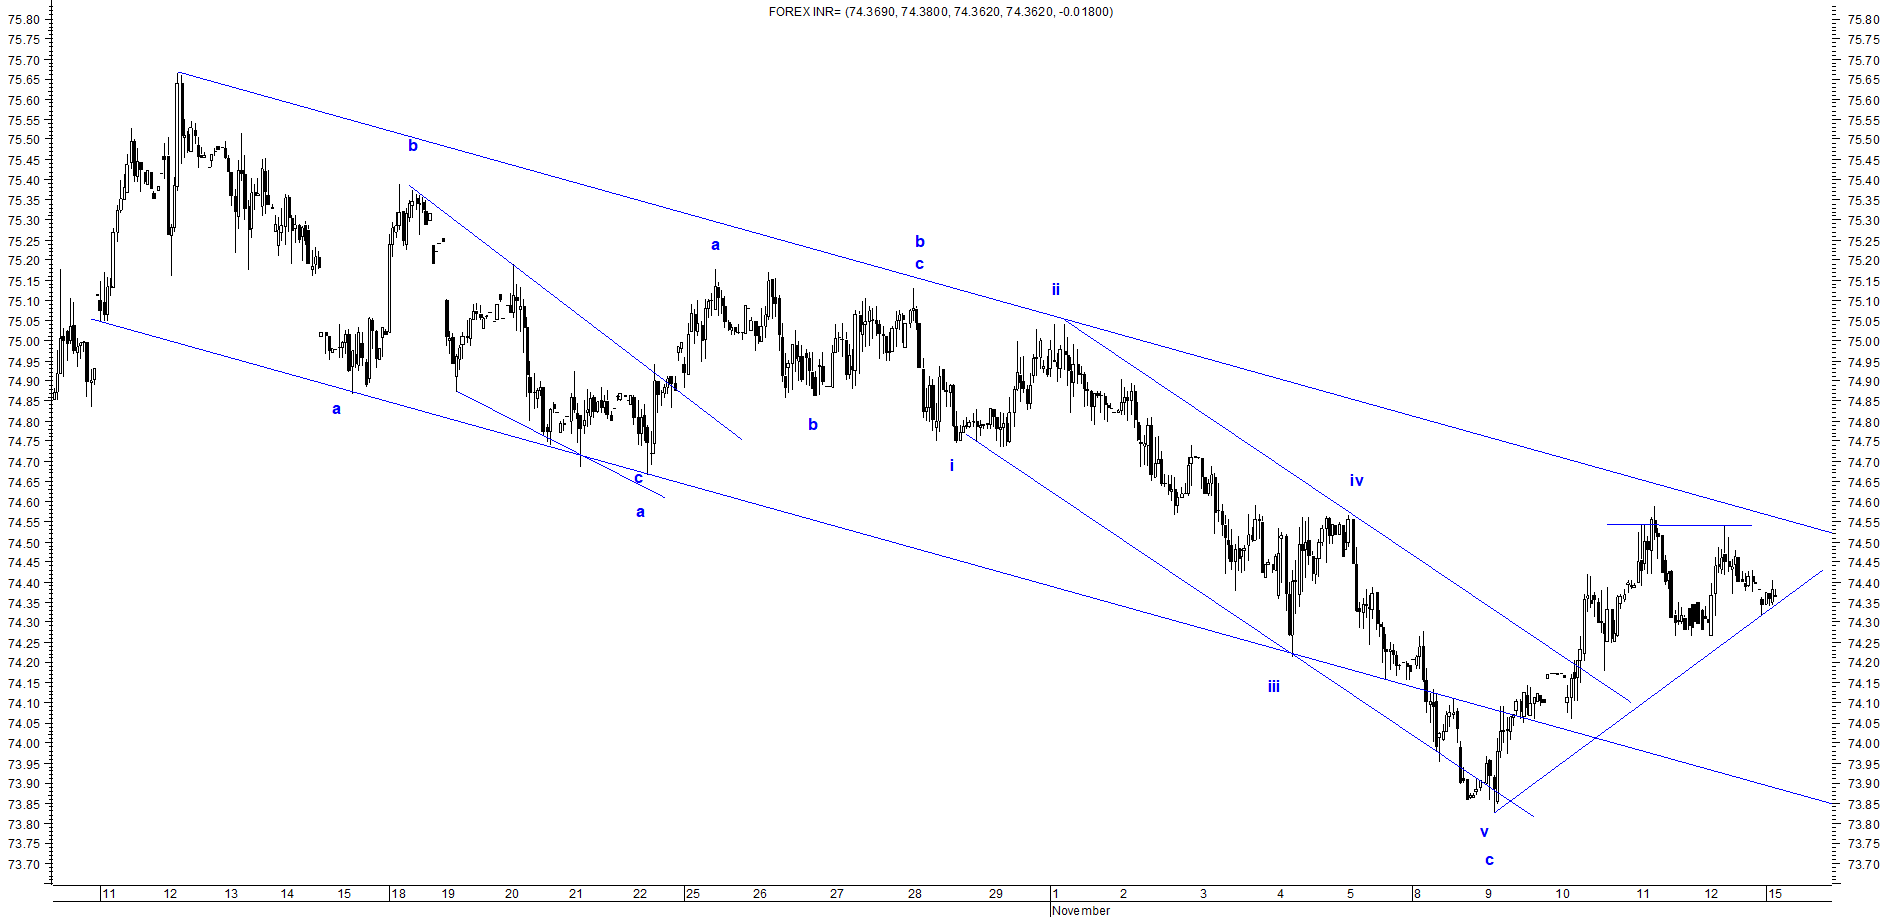
 USDINR Spot daily chart anticipated on 15th November 2021 USDINR Spot daily chart anticipated on 26th November 2021 (Part 1) USDINR Spot daily chart happened on 6th December 2021 From the above chart, I have been continuously saying that the correction is bound to be over once the level of 74.7 is taken out which can soar prices till 75.5. This is what I had mentioned for USDINR (Spot price), " USDINR is all set to move higher from here and can reach till 75.5 over short term once the level of 74.7 is crosses decisively." On 6th December 2021, prices made a high of 75.47 which completes my target of 75.5 thus again helping me to achieve the impossible by applying Elliott Wave Theory. To read the previous article on USDINR you can click on the below link  USDINR : A Completion of Corrective Pattern  https://www.marketanalysiswithmeghmody.com/2021/11/usdinr-completion-of-corrective-pattern.html USDINR : Change of trend (Part 1) https://www.marketanalysiswithmeghmody.com/2021/1

MCX Gold and Elliott Wave Counts

Image
 MCX Gold daily continuous contract From the above chart, the current trend for the yellow metal is sideways and there is not evidence that MCX Gold can climb back above 51000. As many of you are aware that Dollar index is trading above 96, the current inflation y/y of US is above 6%. FED chairperson Jerome Powell is all set to taper the bond purchases and hike interest rate by next year. All these factors are good for Dollar index but bad for Gold. MCX Gold has a positive correlation with USDINR, if the pair is set to move higher as DXY will then the fall in MCX Gold will be less as compared to Comex Gold. Technically speaking, prices are facing the resistance of 50% from its all time high to its recent low 56191- 43500 levels. As far as 46500 is intact expect prices to remain sideways with resistance at 49500 and support at 46500 levels. As per Elliott Wave, prices can show dynamic moves as it can falter towards 43500 or can remain sideways. Let us see the two scenarios Scenario 1- M

USDINR: Change of trend (Part 1)

Image
 USDINR Spot hourly chart anticipated on 15th November 2021 USDINR Spot hourly chart happened on 26th November 2021 In my previous update about the pair, I had mentioned, " USDINR is all set to move higher from here and can reach till 75.5 over short term once the level of 74.7 is crosses decisively." Prices  have surpassed the important resistance of 74.7 and has been trading above 75 levels, my level of 75.5 is still intact as 74.7 will now act a a support. To read the previous article on USDINR you can click on the below mentioned link https://www.marketanalysiswithmeghmody.com/2021/11/usdinr-completion-of-corrective-pattern.html The falling channel is taken out and prices are now moving in a higher highs and higher lows which is a positive formation. I will be monitoring the move in this pair after it crosses or sustains above 75.5 (spot). Now one can trail stop to 74.5-74.6 for the above mentioned target.

Nifty: Is the correction over?

Image
Nifty hourly chart  Nifty has been correcting from past 2 weeks now and has started forming lower highs and lower lows. Today the benchmark made a low of 17283 and closed well above 17400 levels, thereby tumbling 1.96%. The next question comes to my mind and yours too will be, How much more fall? Prices after making an all time high has started correcting and has found support of the falling channel today from where it bounced at the last hour of the trade. There are high chances for the benchmark to bounce from hear and at least test the levels of 17700-17800 levels. From Waves perspective, prices are moving in a corrective wave (a-b-c) where it completed wave c today at 17283 levels. Now there is a possibility for prices to bounce and test either the resistance of the falling channel or a new all time high is set form here. The first option will eventually turn it into double correction (a-b-c-x-a-b-c). The summation is prices are set to bounce back near to 17700-17800 levels over sh

USDINR: A Completion of Corrective Pattern

Image
 USDINR Spot hourly chart As shown in the above chare, prices are moving in a falling channel and it awaits for a bullish break. As far as lower highs and lower lows are intact prices will continue to respect the falling channel resistances and supports. However, as per the wave theory, prices have completed a corrective pattern (a-b-c) and it is all set to move higher which can possibly give bullish break in a falling channel. The other possibility is if it converts into double correction, which will reverse prices from the channel resistance. The summation is USDINR is all set to move higher from here and can reach till 75.5 over short term once the level of 74.7 is crosses decisively.

Tesla: Elliott Wave Analysis and Anticipated happened

Image
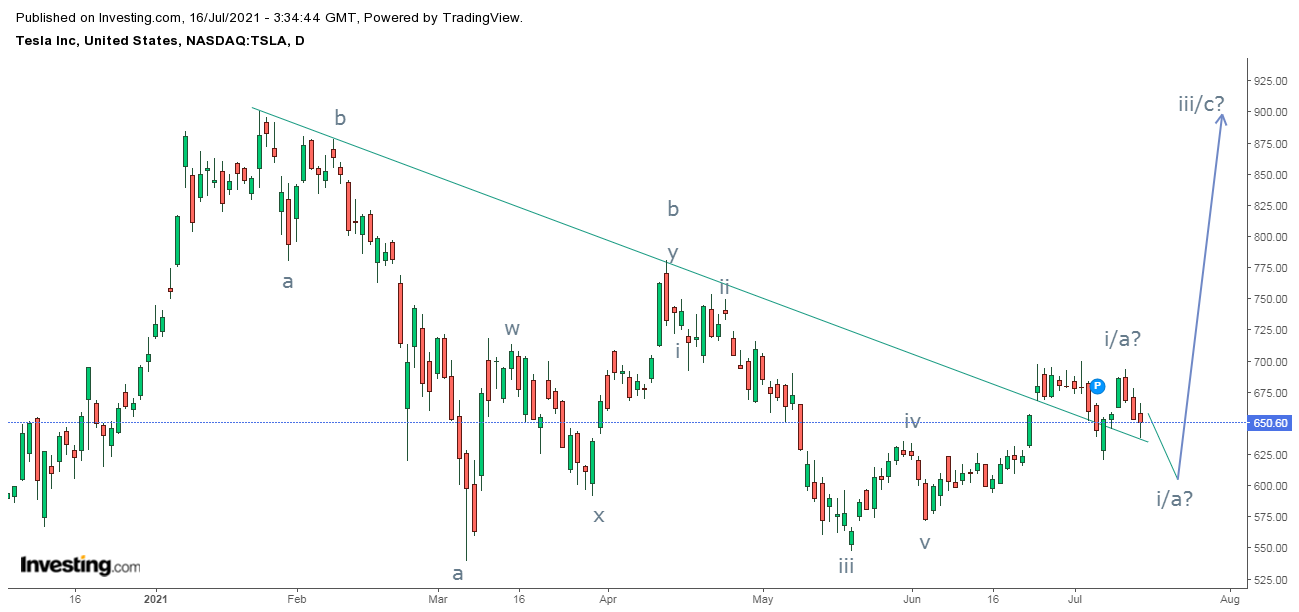
 Tesla daily chart anticipated on 16th July 2021 Tesla daily chart happened on 25th October 2021 From the above chart, prices moved precisely as per my prognostics. I had mentioned for Tesla on 16th July 2021 , " Tesla stock is positively poised and can move higher near till $900 over even cross it over medium term." The stock reached not only $900 but also crossed over medium term as it is currently quoting at $1200 levels odd. To read my previous article on Tesla you can click in the link mentioned below https://www.marketanalysiswithmeghmody.com/2021/07/tesla-elliott-wave-analysis.html At present prices are moving in wave iii which is likely extended and so prices will continue to move higher as wave v is pending on the higher side. Wave iv can correct which can be utilized as a buying opportunity. The summation is Tesla can be bought around $1000-$1100 levels for the level of  $1300-$1450 levels