Posts

MCX Zinc Elliott Wave Analysis

Image
 MCX Zinc hourly continuous chart From the hourly chart, the base metal is surely moving in a positive direction after forming a bullish cup and handle pattern. As far as the low of the handle is intact prices will continue to surge. Also, yesterday it came back to test the support of the horizontal trend line which was earlier acting as a resistance (marked by arrows), this is an indication that prices are at crucial support and can bounce back from this juncture. As per Wave theory, I think prices are moving in a corrective wave (a-b-c) where it is on the brink to complete wave b in a flat pattern and might or will start wave c higher which can go till 244-245 levels. The summation is Zinc is in positive terrain and can move higher from current levels till 244-245 levels over short to medium term.

MCX Copper Inverse Cup and Handle and Elliott Wave Analysis

Image
 MCX Copper hourly continuous chart As shown in the hourly chart, MCX Copper has given a bullish break in an inverse cup and handle chart and also a bullish break in a falling channel, thus opening positive possibilities. As per the pattern the target comes to 763 levels. From Waves perspective, Copper is positively poised as it has completed a corrective wave (a-b-c) and following that it has started impulse wave, in which it has completed wave i and possibly wave ii. This opens wave iii higher which can go till 760-765 levels. The summation is MCX Copper can achieve levels of 760-765 over short to medium term with support at 712.

EURINR Neo Wave Diametric Pattern

Image
 EURINR daily continuous chart From the above daily continuous chart, prices are moving in a sideways to negative direction after a dynamic rise, this can be seen as a move to digest the recent gains. Also there is a certain percentage where prices can retrace, if not then reversal is the beginning orelse a correction. At present it has retraced 50% and it is likely to go and test 61.8%. As shown in the chart, from Neo Wave perspective, prices are moving in a diametric pattern which has seven legs in it (a-b-c-d-e-f-g). Here in this case wave g is pending on the downside which can drag prices near till 87.6-87.5 levels. The summation is EURINR is hovering near resistance and can sink near to 87.6-87.5 levels over short term.  

ICICI Bank Elliott Wave Analysis

Image
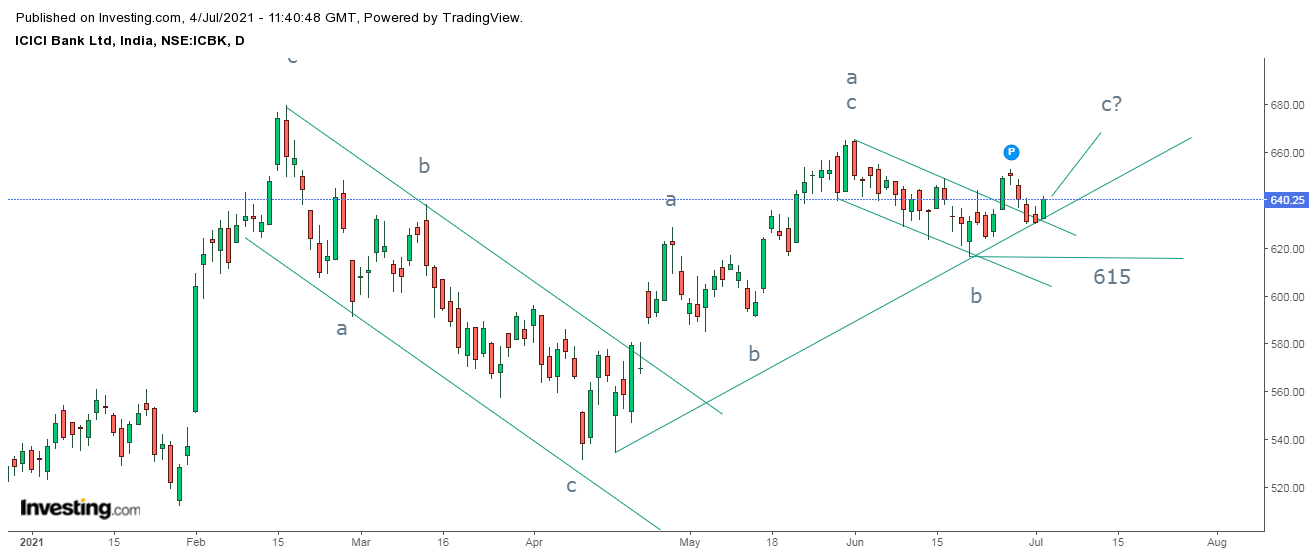
 ICICI Bank daily chart From the above daily chart, the banking stock is in stealth uptrend and will continue to do so as far as prices persist above the rising trend line or there is no discontinuation of the positive formation. The stock recently gave a bullish break in a small falling channel and then came back to re-test the trend line which is now acting as a support (role reversal).Also it is showing signs of resilience from the support zone. As per Wave theory, prices are moving in a flat pattern which can be converted into irregular flat or even a running. This mean I am anticipating wave c of final wave b at one higher degree to either test 680-685 levels over even surpass it which will probably complete wave b. The summation is ICICI Bank is firmly positive and can move higher from current levels close to 680-685 levels as far as 615 is intact on the downside.

Ethereum ETH/USD Re-visited and Elliott Wave Analysis

Image
 ETH/USD daily chart anticipated on 31st May 2021 ETH/USD daily chart happened on 3rd June 2021 In my previous update on Ethereum dated 31st May 2021, I had mentioned two probabilities and it happens to be the former one to be successful. " In wave b wave wave a and wave b is over and wave c can surpass wave a of wave b which can move till $2900-3000 levels." Here is the link of my previous article on ETH, click on it https://www.marketanalysiswithmeghmody.com/2021/05/ethusd-elliott-wave-anaysis.html Here in this case price did not surpass but came close to $2900 which is 50% of the recent fall thus making it a simple zigzag pattern. The falling trend line is crossed thereby giving a bullish break and now there is high possibility for prices to climb over short to medium term. As per waves perspective, prices are moving in an impulse fashion after the bullish break, in which it has completed wave i and wave ii and it is on the verge to start wave iii which can reach near till

USDINR Re-visited

Image
 USDINR daily continuous chart anticipated on 13th June 2021 USDINR daily continuous chart happened on 2nd July 2021 In my previous update on USDINR dated 13th June I had mentioned, " USDINR can move higher from here and can test 73.5 levels over short term and further if it sustains above it can move till 75-75.3 levels over medium term." Prices surged from the support of the trend line and achieved my level of 73.5 followed by 75-75.3 as the pair made a high of 75.07-  Anticipated Happened. Here is the link of my previous update on USDINR which you can read just by clicking on it https://www.marketanalysiswithmeghmody.com/2021/06/usdinr-elliott-wave-analysis-and.html In past two weeks there is been huge volatility in global markets after FED dot plot revealed that they are all set to hike interest rate by 2023. Two rate hikes are all set by FED, but was this the real reason or it was well anticipated ahead of the event as USDINR achieved all my levels. As per wave theory,

MCX Gold Elliott Wave Analysis ahead of NFP data

Image
 MCX Gold daily continuous chart As shown in the daily chart of MCX Gold, prices are moving in a sideways direction in range of 50000-46500, as far as prices persists in this range no directional move can be expected.  At present juncture, prices have bounced from the support level of 46500 and can move higher from here. US is set to release June NFP numbers at 6.00 pm IST. The consensus is 725k and the previous reading is 559k.  There are high chances for gold to move higher and capture 49200-49500, the reason is based on technical assumptions. As per Wave theory, prices are either moving in an impulse or Corrective wave. As long as the support of 46500 holds prices are set to move higher in form of wave c or wave iii which can soar prices near till 49200-49500 over short term. The summation is Gold is set to move higher from current levels to test 49200-49500 levels as far as 46500 is protected on the downside.