ICICI Bank Elliott Wave Analysis
ICICI Bank daily chart
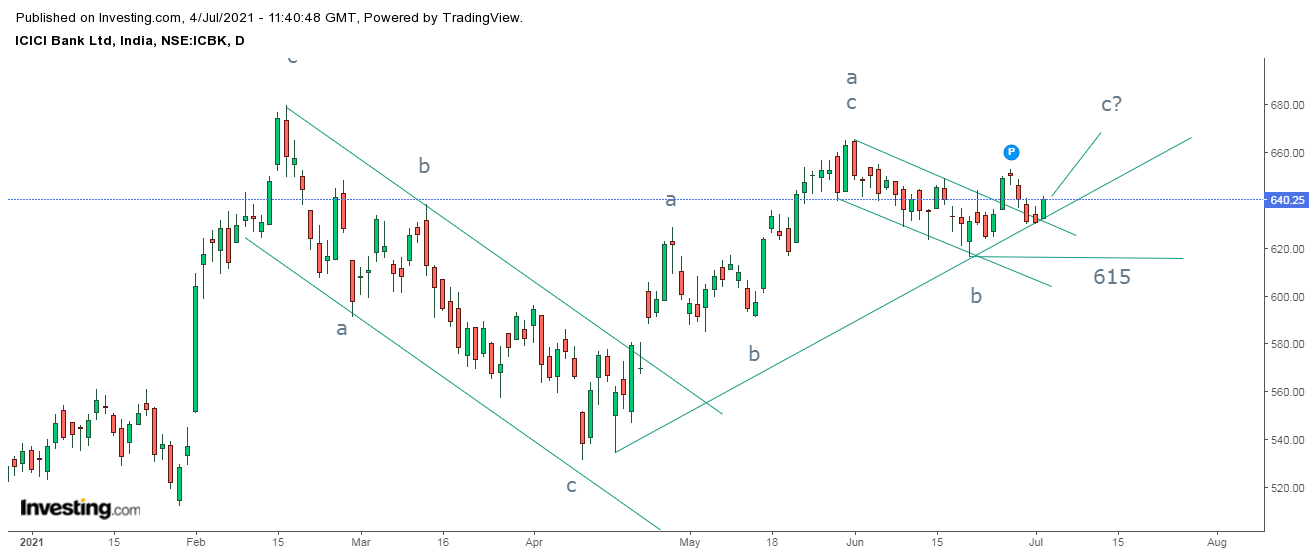
From the above daily chart, the banking stock is in stealth uptrend and will continue to do so as far as prices persist above the rising trend line or there is no discontinuation of the positive formation.
The stock recently gave a bullish break in a small falling channel and then came back to re-test the trend line which is now acting as a support (role reversal).Also it is showing signs of resilience from the support zone.
As per Wave theory, prices are moving in a flat pattern which can be converted into irregular flat or even a running. This mean I am anticipating wave c of final wave b at one higher degree to either test 680-685 levels over even surpass it which will probably complete wave b.
The summation is ICICI Bank is firmly positive and can move higher from current levels close to 680-685 levels as far as 615 is intact on the downside.


Comments