Nifty Elliott Wave analysis

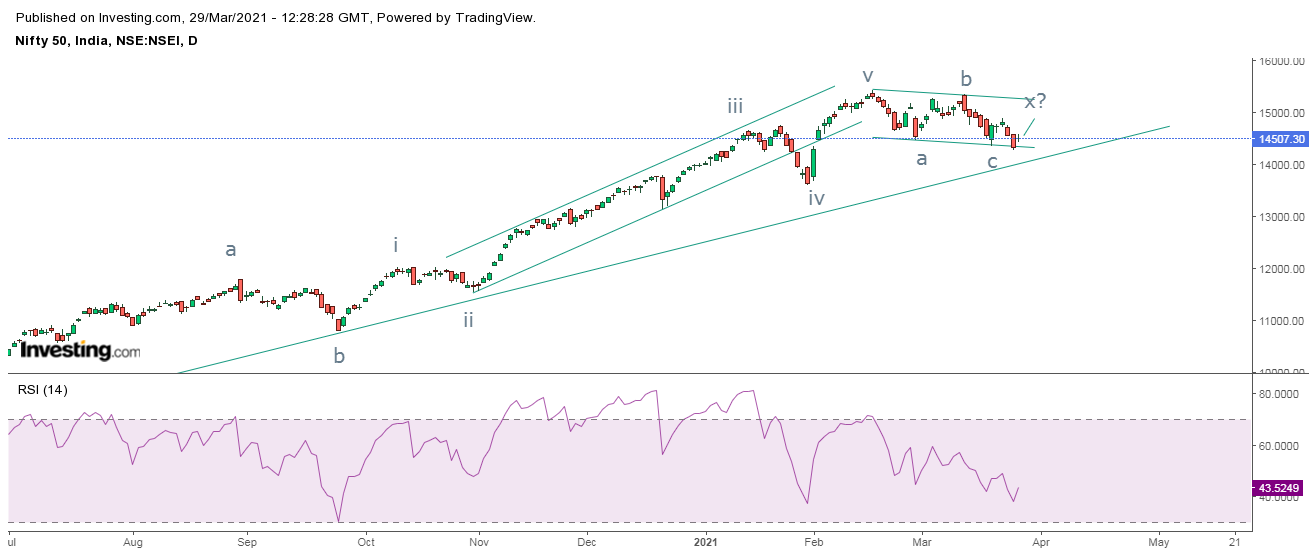
Nifty daily chart Nifty hourly hart From the above daily chart, the index is moving in a sideways to negative direction and has started making lower highs and lower lows. This is an indication that the short term trend has now turned negative. The index has a crucial support at 14100-14000 levels where the rising trend line is placed. It is likely that there will be resilience from current levels which can push the index near to its previous high. Daily RSI has still not broken its previous low. In hourly chart, prices are moving in a falling channel, it has found support near to the lower trend line of the channel and has bounced from there several times. On last Friday, the index opened with a gap up and continues to soar. RSI has a support at 30 and it shows that it is now moving higher. From Waves perspective, the Nifty is moving in double correction where after completing (a-b-c) in flat pattern, it is now forming wave x which is also a flat pattern and in which wave c is...


