Posts

SBIN Elliott Wave Analysis

Image
 SBIN daily chart SBIN hourly chart As shown in the daily chart, the banking stock is moving in a rising black channel and it is very obvious that the trend is firmly positive. The stock has crossed its previous high which opens further positive possibilities that it will continue to move up. To understand the strength of the current trend or rally, I have applied ADX in the lower panel which gives you a snapshot of how strong the rally is. As of now it is above 40 which clearly states that it is in mature stage and can go till 60-65 levels. In the hourly chart, prices are moving in a higher highs and higher lows formation and it has formed a measuring gap which is not filled yet. Measuring gap occur in-between the rally and remains unfilled. It also gives the target of the rally and it comes to around 460 for this banking stock. However, it is too soon to come to this target and so I think the current pattern which is on the brink to complete will help to define the target. The cont

Exide Inds Elliott Wave Analyis

Image
Exide Inds daily chart  Exide Inds hourly chart As per daily chart, the stock is moving in a higher highs and higher lows and has also given a breakout in bullish cup and handle pattern at 175. The target of the pattern comes to 225 which is measured from the depth of the pattern adding it to the breakout level. It has successfully crossed its previous resistance of 207 but has closed below it last week. Any move above 207 will be a buy opportunity. From hourly chart, prices are persisting in a rising channel formation. As far as it is within this channel the bias remains positive and prices will continue to soar incoming trading sessions. RSI has also relieved from the overbought terrain As per Wave theory, prices are moving in wave c in which it has completed wave iii in extension and wave iv lower, now it is opening wave v which will be impulsive in nature and will continue to move higher to complete wave c. The summation is Exide Inds is positively poised, a sustainable move

Tata Steel Elliott Wave Analysis

Image
 Tata Steel daily chart Tata Steel hourly chart As shown in the daily chart, the metal stock has shown strength from the support of 600-610 where the horizontal line is drawn. Also it is very visible that, prices have closed above both the moving averages without giving a bearish crossover. As far as higher highs and higher lows are intact, prices will continue to move in a positive direction and in this case it will cross its previous high. Daily RSI has crossed the center line from below thus giving buy signal. In the hourly chart, price has corrected from the recent high and is all set to soar in further sessions after bouncing from support area. However, RSI is in overbought terrain and there are high chances it might relieve from the overbought territory which can drop prices lower. Once it corrects or moves sideways it can then be bought. From Waves perspective, the stock is moving in wave 5 after possibly completing wave 4 lower. This means that in wave 5 prices will cross i

GBPINR Elliott Wave and Neo Wave Analysis

Image
 GBPINR Fut hourly continuous chart From above chart it is very clear that, prices have formed a distribution pattern which is an indication that the pair will sink going head. The pair from 100 is now trading down to 99.5/6, such dynamic fall is only possible with formation of a pattern on upside. I have found a distribution pattern which is a rising wedge, prices can dip near to its previous low which is 99, any break below this level will infuse further selling pressure dragging it till 97-96 levels over medium term. From Wave perspective, ending diagonal in wave v is evident also in wave iv we can see bow and tie diametric which has seven legs in it (Neo Wave). After wave v prices will move in corrective form which I will monitor and keep updated. Education Learn Technical Analysis in our 4 month course to help you to identify better trade setups. This course will be conducted every twice in a week for around 2 hours. This theory can be applied on all free floating markets. In this

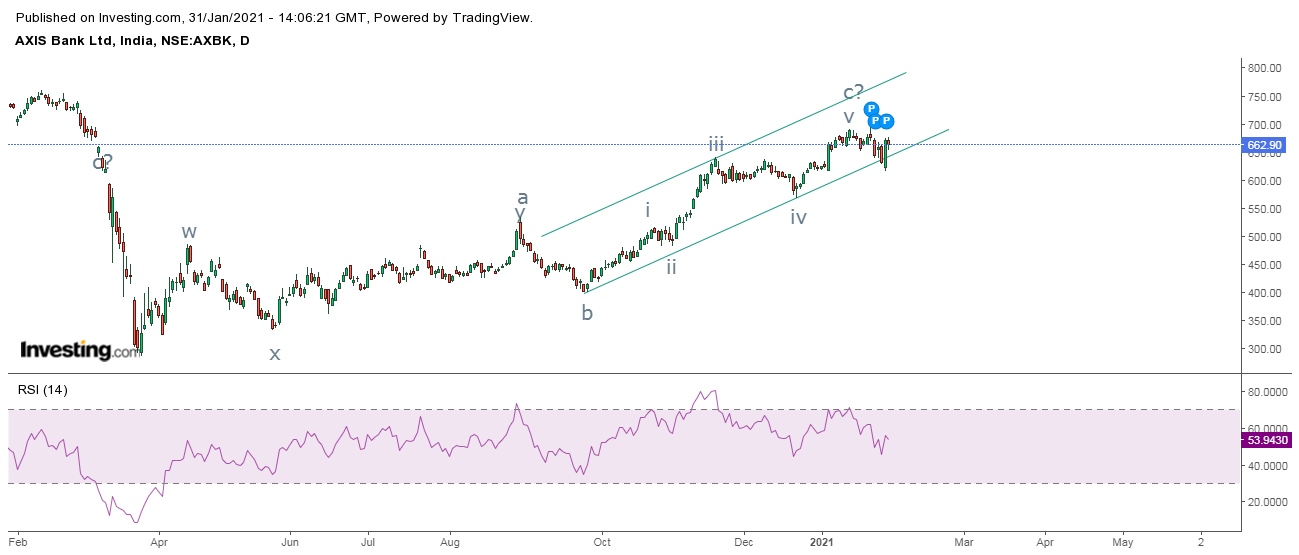
Axis Bank Elliott Wave Analysis

Image
 Axis Bank daily chart Axis Ban hourly chart As per daily chart, the banking stock, tried to break the rising trend line support but quickly picked up momentum and turned higher. Daily RSI have taken support from its previous low marked by horizontal black line, indicating that prices might jump from current levels. From hourly chart, there is no discontinuation of higher high and higher lows and so as far as prices persists in the rising channel the bias is positive and can rest till its previous high or near to it. Prices can travel till 685-689 levels over short term with support at 648 (closing basis). There is still some vacuum for RSI to reach till overbought terrain. As per Wave theory, the stock is moving in wave b which looks to be a flat, irregular flat or running flat pattern. It will depend how wave b will move or much percent till will retrace of wave b as compared to wave a of wave b. At present till has retraced 80% of wave a of wave b and can move till 100% or even

Nifty Elliott Wave Analysis

Image
 Nifty daily chart Nifty hourly chart As shown in the daily chart, the index has broken the rising trend line support and it has slumped lower by taking out over 1000 points from the all time high. This was one of the sharpest reversal occurred at the top which suggests that, it is going to be difficult for the index to make new high in the span of next six months. Also the ADX (red line) which is in a matured stage is indicating that the recent uptrend is languishing. In the hourly chart, prices have arrived near the trend line support (lower rising trend line). Any move below this trend line support will infuse further selling pressure. However, failure to break this support will open the possibility for a relief rally coming in which can soar it till 14200 levels which was earlier acting as a support now resistance (polarity reversal). RSI is exhibiting positive divergence but it still needs confirmation which can only be obtained over period of time. From Waves perspective, my

SBI Elliott Wave Analysis and Technical Analysis

Image
 SBI daily chart SBI hourly chart As per daily chart, the banking stock is positively poised and it is moving in a positive trend. As of now it is trading near the important support zone. Also it has formed a rounding bottom and the target of the pattern comes to 316 levels. RSI has relieved the overbought zone and can quickly move back up from here. From hourly chart, higher highs and higher lows are intact and prices are all set to rise from current levels as far as 275 is intact on the downside (closing basis). RSI is near to the oversold terrain and can move back up from here. As per Wave theory, the stock is moving in wave v of wave c. The ongoing leg has still some vacuum to reach its target. The summation is SBI is all set to climb near till 312-316 resistance zone over short term ith support at 275 (closing basis). Education Learn Technical Analysis in our 4 month course to help you to identify better trade setups. This course will be conducted every twice in a week for