Nifty Elliott Wave Analysis
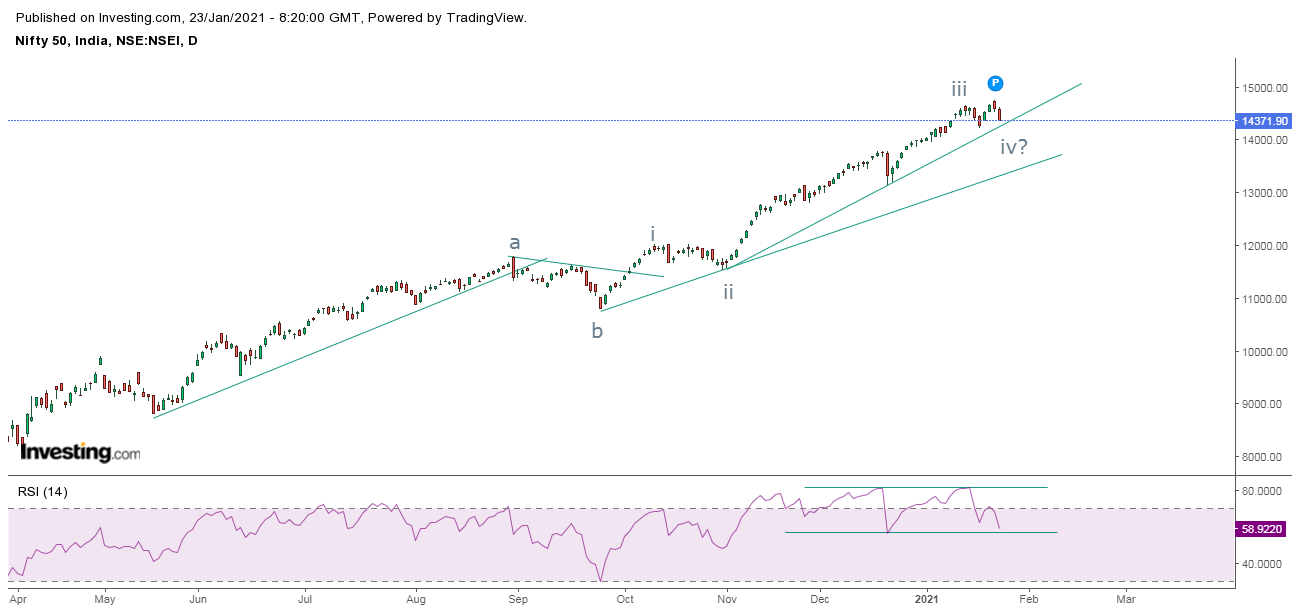
Nifty daily chart Nifty hourly chart As shown in the daily chart, Nifty is moving in a higher highs and higher lows and it is trading well above the rising trend line. On last trading day of the week, prices slumped by over 1.5% down by over 200 points but it managed to protect the rising trend line, thus taking its support. An important observation seen on RSI, it is moving in a stiff zone as marked by two horizontal lines. As of now it is taking support of it and can move back up to its resistance. In the hourly chart, the index is moving in a range of 14650/700- 14200 levels (marked by horizontal black lines). As far as price persists in this zone it will move in a sideways pattern. Also it is imperative to avoid that prices are near to an important support zone (confluence zone). RSI has reached oversold terrain and can move back up soon. From Waves perspective, I had mentioned that prices will move down in wave iv after completing wave (v) of wave iii, which can go till 14100