Posts

Hindalco Elliott Wave Analysis

Image
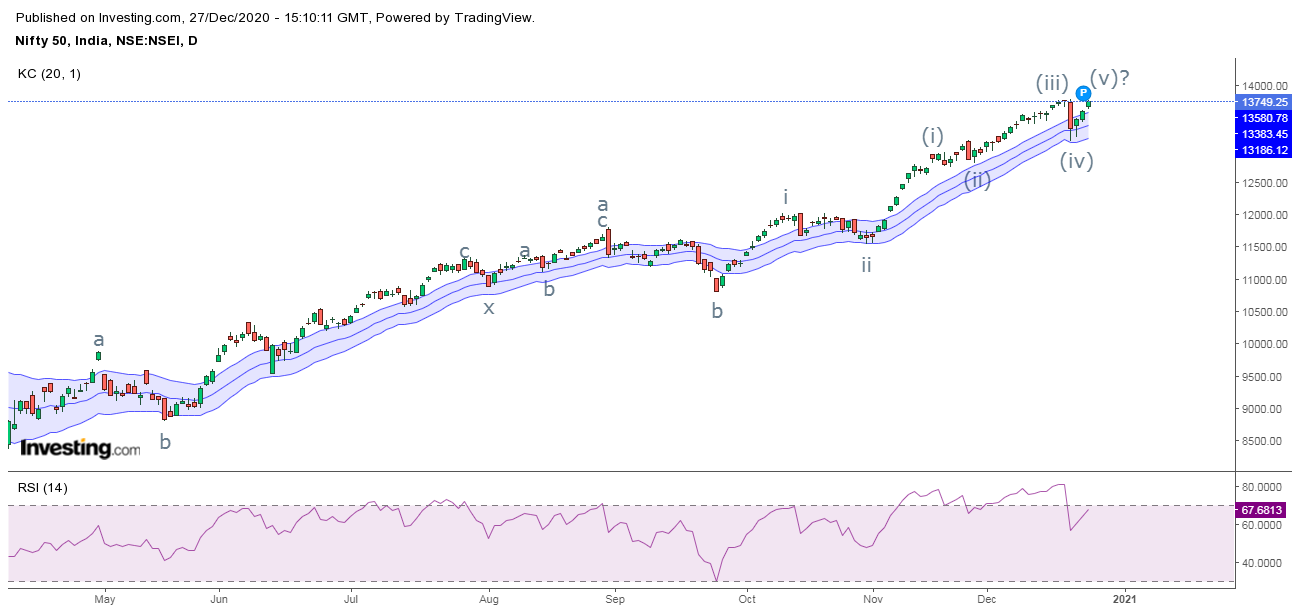
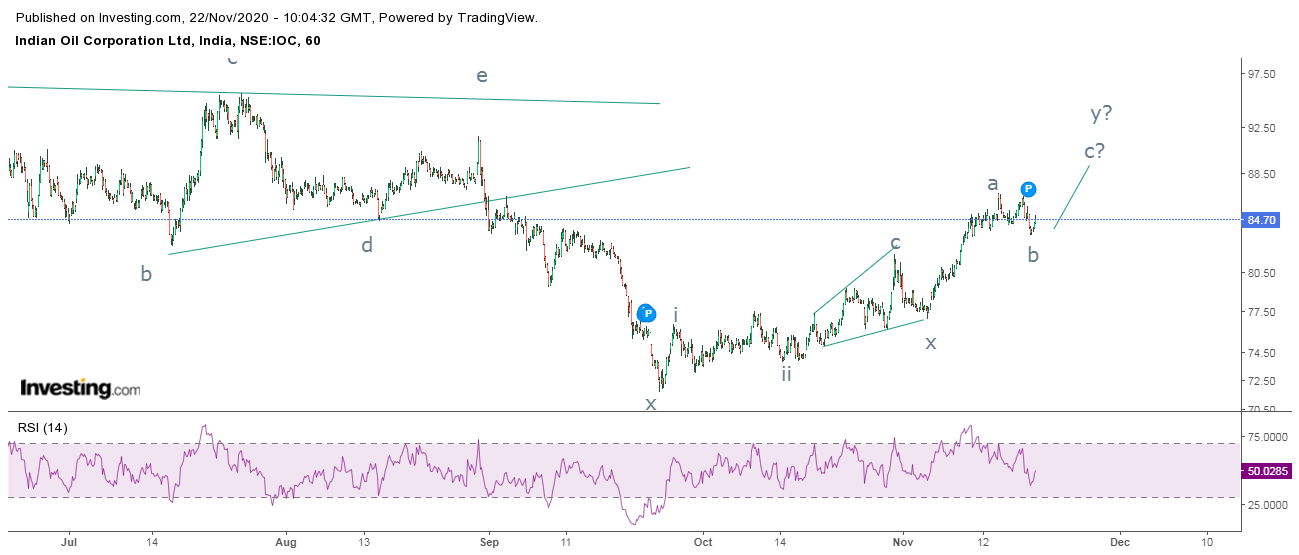
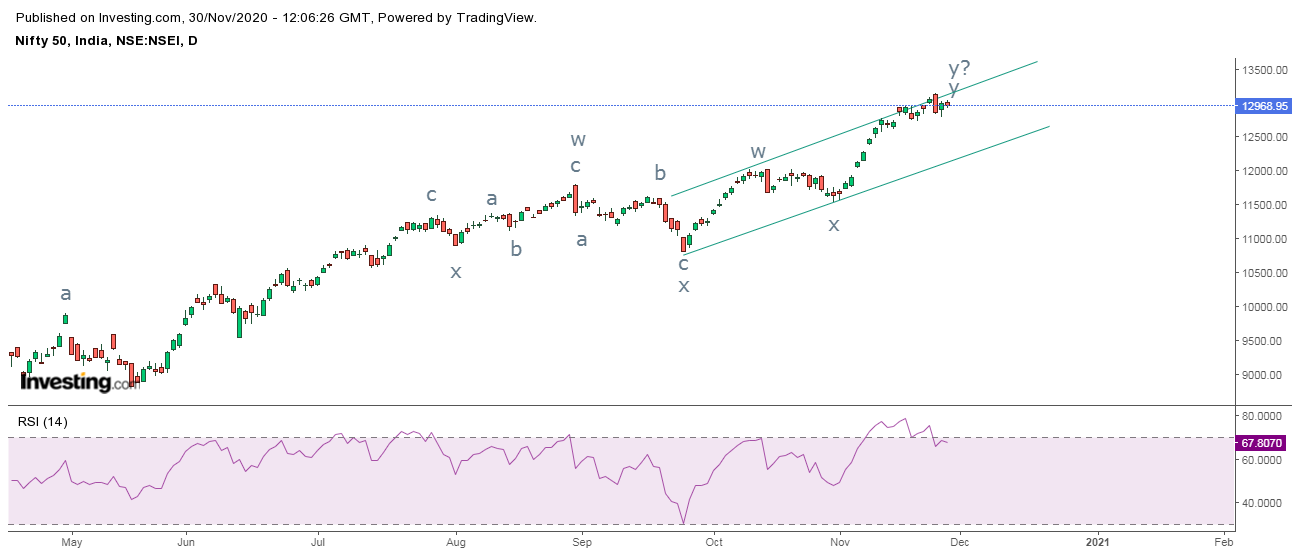
 Hindalco daily chart Hindalco hourly chart From the above daily chart, the metal stock is moving higher by crossing its previous high and it is also positively poised. Recently it has bounced from the lower Bollinger Band which is actually acting as a support. As far as prices are above the lower Bollinger Band prices are expected to cross its previous high which is placed at 256 levels. As per hourly chart, prices corrected after a dynamic move which also made RSI to move down near to the oversold terrain. Also it is important that 256 is crossed decisively which will open further positive possibilities. Elliott Wave theory suggests that, prices are currently moving in wave iii at one higher degree. At present prices have not moved up till 100% of wave i to wave ii (one higher degree), this means there is a possibility for the stock to move till 272 levels (minimum). T he summation is Hindalco if crossed 256 levels will soar it till 272 levels which is the minimum criteria, any

Nifty Elliott Wave Analysis

Image
 Nifty daily chart Nifty hourly chart In the above daily chart, the index has moved in a positive direction by forming a higher highs and higher lows. Also by applying Keltner channels, it is very clear that prices has given close above the upper Keltner band on Thursday and closed above its previous high on the last day of week which gives a positive break in price action. RSI has relieved from the overbought zone and it is all set to move back in. In the hourly chart, prices are moving in a rising channel formation where recently it bounced from the lower end of the channel and can move higher to test the resistance. It is imperative for prices to cross13780 levels where there is small hindrance, thus infusing further buying. RSI has still room to go in the overbought zone. From Waves perspective, prices are moving in wave c where wave iii is extended in which wave v is ongoing and can till 14000 levels which is 61.8% from wave (iii) to wave (iv). The summation is Nifty needs t

GBPINR Elliott Wave Analysis

Image
 GBPINR daily fut chart GBPINR hourly fut chart From the above daily chart, Cable has just crossed its previous resistance level marked by horizontal line and it is currently trading above it, a sustainable move above this level will infuse buying pressure soaring it above its recent high. RSI which has relieved from overbought zone is now picking up momentum. As per hourly chart, the pair is moving in a higher highs and higher lows and it is on the brink to cross its previous high. Also there is least possibility for prices to move down from current levels as it is positively poised. Elliott Wave theory suggests that, prices are moving in wave v in which it is on the brink to complete wave iv of wave v of wave c, once this is completed wave v of wave v will start surging it ill 101 levels. T he summation is GBPINR is all set to move in a positive direction and can cross its previous high in coming trading session ending it near to 101 levels. Education Learn Technical Analysis i

IOC Antcipated Happened and Elliott Wave Analysis

Image
 IOC hourly chart anticipated on 22nd Nov IOC hourly chart happened on 3rd Dec 2020 In my previous update dated 23 rd November 2020, I had mentioned that, “ IOC is all set to soar till 88-90 levels over short term with support at 81 (closing basis).” The stock moved above the mentioned level and made a high of 97 levels, thereby achieving my level when the stock was quoting at 84 levels. In the hourly chart, prices are moving in a higher highs and higher low, there is no discontinuation of this positive formation and so it is imperative either to break the rising trend line or its previous lows. From Waves perspective, the stock has completed double correction pattern (a-b-c-x-a-b-c) and it is possible it can start triple correction as well but the counter trend which is wave x is pending, retracing till 91 levels. The summation is IOC can tumble near till 91 levels with resistance at 95.9 (closing basis). Ay move below 91 will open further negative possibilities Education Lea

Nifty Bank Elliott Wave Analysis

Image
 Nifty Bank daily chart Nifty Bank hourly chart From the above daily chart, Nifty Bank is currently moving in a sideways pattern at the top and also there is a distribution pattern occurring supported by negative divergence in RSI making it difficult for the index to move up further. Again just like Nifty, banking index need to break its previous lows to plunge in coming trading sessions. As per hourly chart, Prices are consolidating near the resistance of the rising channel making the index halt its positive momentum. Prices need to break the level of 28860 levels for downside to open. The index is also forming a rising wedge pattern which breaks on the downside. It is advisable to wait for the bearish breakout to occur. RSI is exhibiting negative divergence. Elliott Wave theory suggests that, Prices are forming ending diagonal pattern in wave c of wave y at one higher degree, which will open negative possibilities going ahead. Once this pattern is completed it is evident that the

Nifty Elliott Wave Analysis

Image
Nifty daily chart Nifty hourly chart In the above daily chart, Nifty is moving in a higher highs and higher lows and it is moving precisely in a small rising channel. At present it is consolidating near the resistance of the channel, finding it difficult to move up which opens high possibility for prices to correct from current levels. Also daily RSI is all set to relieve from overbought zone. In the hourly chart, it is very evident that prices are still in uptrend, to change the trend it is imperative for the index to break the level of 12800 which will complete bearish head and shoulder pattern, thus making the index weak, also RSI is exhibiting negative divergence indicating halt in positive trend. From Waves perspective, the index is probably moving in an extracting triangle at the top (a-b-c-d-e), where wave y and wave y at one higher degree will complete. The summation is Nifty will only be in bear grip once the level of 12800 is broken decisively thus tumbling the index ti

Federal Bank Elliott Wave Analysis

Image
 Federal bank daily chart Federal bank hourly chart In the above daily chart, Federal Bank is moving in a sideways to positive direction and it is also moving in a rising channel formation which clearly indicates that the trend is firmly positive. However, RSI is relieving from the overbought terrain In the hourly chart, as far as prices persist in rising channel formation the bias continues to be positive for this banking stock. However, the positive momentum seems to take a breather which can make price move a bit sideways. There is a strong support at 51 which I think will not be broken and prices then can move up and even cross its previous high. From Waves perspective, Prices are moving in a rising wedge or ending diagonal pattern, here it has completed wave i and wave ii is ongoing. It will start wave iii up followed by wave iv and wave v which will be the termination point, thereby completing wave c at one higher degree. The summation is Federal Bank has a strong support a