Posts

NTPC Elliott Wave Analysis

Image
 NTPC daily chart NTPC hourly chart From the above daily chart, stock prices are moving in a higher highs and higher lows fashion which is a positive formation. As far as there is no discontinuation of the above mentioned pattern the bias for this stock will be positive. As per hourly chart, NTPC is moving in a rising channel formation which is a positive sign. Recently it bounced from the support of the channel and is now all set to surge till its resistance. There are high chances for the stock to cross its previous high. RSI is consolidating just above the center line. Elliott Wave theory suggests that, after completing wave x at one higher degree, prices are moving in double correction pattern (a-b-c-x-a-b-c). Recently it completed wave x and is now to start second correction which is wave a, which can move above wave c of the first correction T he summation is NTPC is positively poised and can move up from current levels to test 94-95 levels with support at 89 (losing basis)

IOC Elliott Wave Analysis

Image
 IOC daily chart IOC hourly chart In daily chart of IOC, prices continue to move in a positive direction by crossing its previous high, this opens positive possibilities. Also it is very much possible for the stock to cross its previous high in coming weeks. However, RSI is in overbought zone and is relieving from it. From hourly chart, after making a low near to around 72, higher highs and higher lows is clearly visible. Prices are all set to cross its recent high and can move up further in coming trading sessions. With a support at 81 the stock can travel till 88-90 levels. As per wave analysis, the stock is moving in a double correction (a-b-c-x-a-b-c). Where it has completed wave a and wave b of second correction and now it is expected that wave c will open higher. The summation is IOC is all set to soar till 88-90 levels over short term with support at 81 (closing basis). Education Learn Technical Analysis in our 4 month course to help you to identify better trade setups. Th

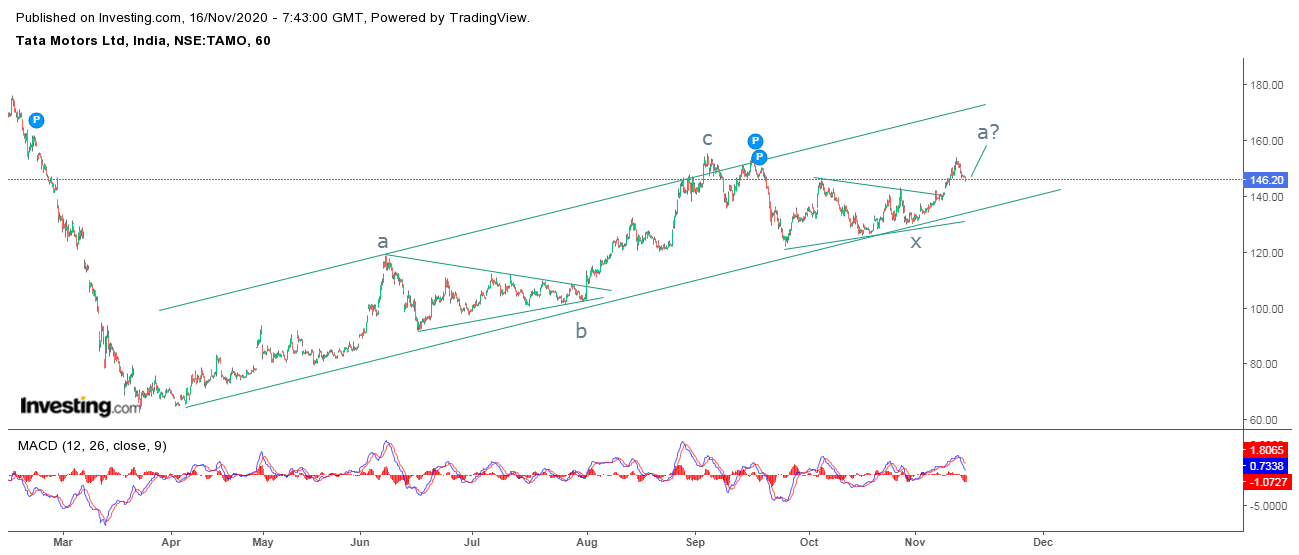
Tata Motors Elliott Wave Analysis

Image
 Tata Motors hourly chart From hourly chart, the auto stock continues to move in a higher high and higher low formation and it is precisely moving in a rising formation. As far as prices persist in the rising channel the bias will continue to be positive. MACD is also in a positive terrain. As per wave analysis, the stock is moving in a double correction as of now(a-b-c-x-a-b-c). Recently it completed wave x in a triangle pattern and it is all set to complete wave a of second correction after that wave b will start in the opposite direction. In short, prices are expected to move in a positive direction near till 155-158 levels with support at 144 (closing basis). Learn Technical Analysis in our 4 month course to help you to identify better trade setups. This course will be conducted every twice in a week for around 2 hours. This theory can be applied on all free floating markets. In this course learn from basic to advance and the fees for the same will be Rs. 12,000/- Elliott and N

Gail Elliott Wave Analysis

Image
 Gail daily chart Gail hourly chart From the above daily chart, the stock has given a bullish trend line break which was falling in nature. Also previously the stock was moving in a lower highs and lower lows but recently it protected its previous low and showing signs of cross the previous high (drawn by rising trend line). As per hourly chart, Gail reversed from 61.8% from the recent high (65.35-106.90), this is a crucial support as it is a Fibonacci number. There are high chances now that the stock will cross its previous high or can test the recent one which is placed at 106 levels. Elliott Wave theory suggests that, the entire rise followed by the fall was corrective in nature, where wave b was completed at 61.8% and now wave c has started up in which it is moving in wave iii followed by wave iv (counter trend) and wave v. The summation is Gail can move up near to 103-106 price zone from current levels with strict stop loss at around 88 (closing basis). Education Learn Techn

Canara Bank Elliott Wave Analysis

Image
 Canara Bank daily chart Canara Bank hourly chart In the above daily chart, Canara bank is moving below the black trend line which is falling, this clearly indicates that the trend is negative for this banking stock. Daily RSI has also reversed from the overbought zone and it is just above the level of 50. In the hourly chart, prices are moving in a sideways direction mainly in a range of 96-85. Recently it tested the upper range and is now moving down to probably test the lower range of the pattern. Hourly MACD is in negative terrain which is below the center line giving a sell signal. From Waves perspective, it seems that prices are moving in wave c after completing wave b in a flat pattern. This wave c which will be impulsive in nature will test 85-82 levels. The summation is Canara Bank is negatively poised and is all set to plunge within 85-82 price zone with resistance at 94 (closing basis). Education Learn Technical Analysis in our 4 month course to help you to identify

Nifty Elliott Wave Analysis

Image
 Nifty daily chart Nifty hourly chart In the daily chart, the index continues to progress as the daily candle along with weekly candle is showing strength. However, it is imperative to be cautiously positive as it is arriving near the overhead supply (marked with downward arrows). The level of 12500 is its preceding high and it is likely that profit booking can be witnessed at this level. Also daily RSI has arrived near overbought zone which suggests that no initiation of fresh long position is advisable at current juncture. As shown in hourly chart, higher highs and higher lows are still intact with prices moving in a rising channel formation. The only way to identify a reversal is to wait for important supports to break, in this case any move below 12040 will infuse selling pressure dragging it near to 11555 levels over short term. As per Wave theory, the index moved up in form of wave v which is the last leg of wave c. As of now it is ongoing but this leg has also arrived near t

Nifty Bank Elliott Wave Analysis

Image
 Nifty Bank daily chart Nifty Bank hourly chart In the above daily chart, Nifty bank is moving up by crossing its previous highs and protecting its previous lows and it is moving precisely in rising channel formation. On last day of the week, the index managed to cross its channel resistance thereby indicating further upside, this is a common mistake all traders and investors do as it is also termed as overthrow. Daily RSI is in deep overbought terrain. In the hourly chart, there is a small rising channel drawn which indicates that prices are in a firm buy mode. However, on Friday the index closed near to the resistance of the channel. Whenever, prices arrived near to the resistance of the channel it has witnessed selling pressure (marked by downward arrows). From Waves perspective, the index is on the brink to complete wave v of wave c and thereby it is very much possible for prices to reverse. Price confirmation for reversal is mandatory which will also start fresh leg on the dow