Posts

Nifty: Elliott Wave Forecast

Image
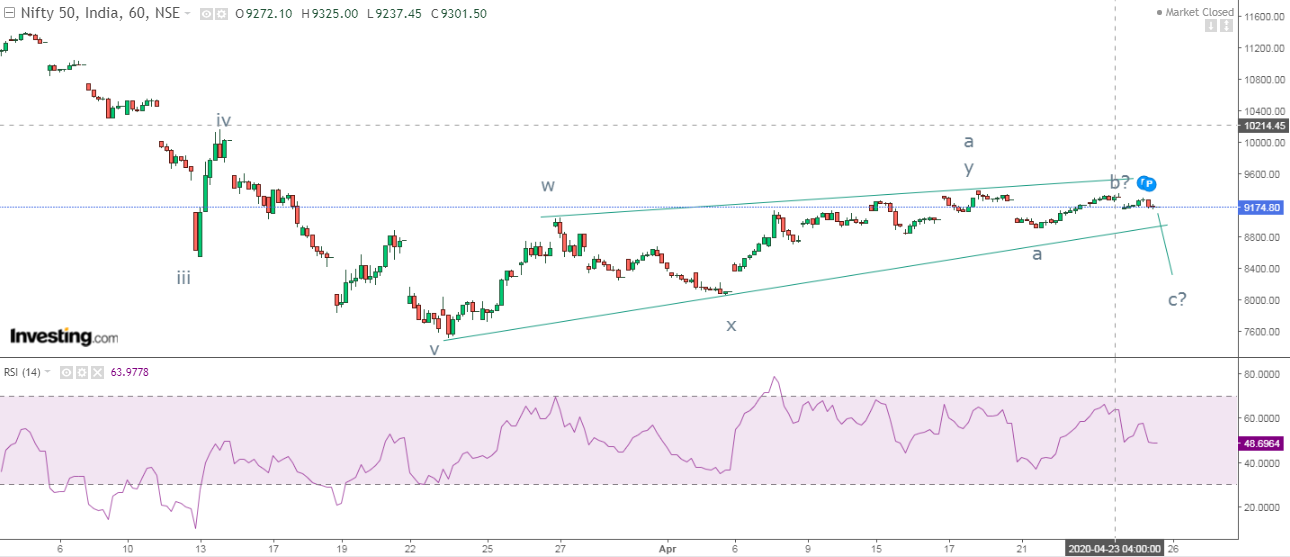
Nifty Daily chart Nifty hourly chart In my previous update dated 4 th May 2020, I had mentioned that, “ Only a move below 9260 can stumble this index till 9100 for short term. For medium term the bias is firmly negative which can drag it till 8030-7900 levels.”- Anticipated Happened. Here is the link of my previous article:  https://www.marketanalysiswithmeghmody.com/2020/04/nifty-elliott-wave-analysis.html In the above daily chart of Nifty, the index is now moving in a negative direction, currently it is in a counter trend, once it is completed it will continue to falter. It is difficult to move above 9500 which is 61.8% retracement of the previous downfall of 9889-9116. From hourly analysis, a bearish island reversal is seen (circle) which opens negative possibilities, prices after a steep fall from the top of wedge pattern is now witnessing s sideways action, the capping to this pattern is at 9400-9500 levels. Stochastic is moving out of the overbought

EURINR: Elliott Wave Forecast

Image
EURINR daily continuous chart EURINR hourly continous chart From the above daily chart, the pair has not started lower highs and lower lows and so it is moving in a sideways pattern. It seems that this pattern will terminate which can eventually lead to break of its previous low of 80.30. Daily RSI is below 50 which is in a selling terrain. As per hourly chart, after giving a bearish break in an ascending triangle pattern, prices are moving sideways, it is imperative for it to break the level of 81.60 levels which will give a price confirmation that the trend is negative. A move below 81.6 can drag prices near till 80.30 or even break it. As per wave theory, I am opening two possibilities which is a complex correction w-x-y and second is a-b-c. The triangle is completed where wave b/x is marked which opens wave c/y on the lower side dragging prices near till end of wave a at one higher degree. The summation is prices need to break 81.6 which can make it plunge till 8

MCX Crude wave analysis

Image
From the above daily chart, prices are moving in a falling channel (shaded part), recently it bounced from the lower end of the channel and is now poised to move near till resistance. Daily RSI is exhibiting positive divergence which is an indication that the negative momentum is at a halt (marked by black line). As per hourly chart, prices are moving in a higher high and higher low pattern after forming a low at 800 levels. It is moving precisely in a rising channel (shaded part). The first threshold will be at the horizontal line marked which is place at 1755 levels. However, RSI is in overbought zone and can relieve first. As per wave theory, prices have completed wave v and it has started moving higher in form of new leg, this can be wave i or wave a and can move up near till 1755 levels. The trend as of now is firmly positive. The summation is prices are all set to soar near till 1755 with support place at 1390 levels, the bias is positive.

Nifty Wave Analysis

Image
In the above daily chart of Nifty, prices continue to move in a rising wedge pattern which is a negative sign as any time this pattern will end eventually turning the positive momentum into negative. Daily RSI is above 50, and it is likely to face resistance in near term. From hourly analysis, a throw over is seen which is possibly the end of the wedge pattern, this can also be a bull trap as prices will move down in dynamic fashion, it is important for the index to break ... which can tumble it near till ... levels over short term. I will continue to say that my earlier levels for Nifty was ... levels, I will change to ... levels over medium term. As per wave theory, a complex correction pattern (w-x-y) is still going on which will complete wave a at one higher degree, after that a three wave structure will open to complete wave b which can retrace ... which is nearing to ... levels. The summation is, only a move below 9260 can stumble this index till ... for short term. For

Nifty Elliott Wave Analysis

Image
Nifty hourly chart From hourly analysis, there is no discontinuation of higher highs and higher lows and so it is difficult to say that the trend is negative, but a move below ... which is the black horizontal line can open negative possibilities. As per wave theory, the index has completed wave a in a complex correction and now it is moving in wave b which can falter till ....% of wave a of one higher degree which comes to .... levels. The summation is, it is imperative to remain cautiously positive for the index, any move below... can drag it till .... levels in near to medium term. Learn Elliott Wave and Neo wave in my 1 month course which will be a paid webinar scheduled twice a week, the fees for the same will be Rs. 10,500/-. Call +919324174580 for registration and enquiry.

SBI: Neo Wave Diametric and possible triangle pattern

Image
SBIN hourly chart From the above chart, I have drawn Neo Wave diametric pattern to complete wave b at one higher degree. After that wave c is still ongoing in which wave iii was extended and as of now wave iv of wave c is in making, now this can eventually turn into symmetrical triangle as shown in the above chart. The other possibility is wave iv is completed in a complex correction (w-x-y) and it is now on the brink to start wave v of wave c lower, as soon as the level of ... is broken prices will start wave v which can falter till ... which is ...% of wave .... Find out which level it is that will complete wave iv and moreover Learn Elliott and Neo Wave with me in my paid webinar of one month, schedule twice a week covering theory and practical applications in Rs 10,500/- for registration call +919324174580

MCX Zinc Mini YouTube video

Image
The above video is on MCX Zinc Mini where I had taken chart and manually counted Wave counts, the video shows how accurate I was in calculating. The below link is how I had taken the 10th March chart which became a fact after almost 2 months. https://www.marketanalysiswithmeghmody.com/2020/03/mcx-zinc-mini-elliott-wave-forecast.html Learn Elliott-Neo Wave in my 1 month course for twice a week to understand all the concepts of time and price and all the patterns of the above mentioned analysis. This can be done in my webinar so don't miss the opportunity of the ongoing lockdown, learn something valuable. The fees for the same is RS. 10,500/- contact +919324174580 for registration and enquiry.