Nifty Elliott Wave Analysis
Nifty hourly chart
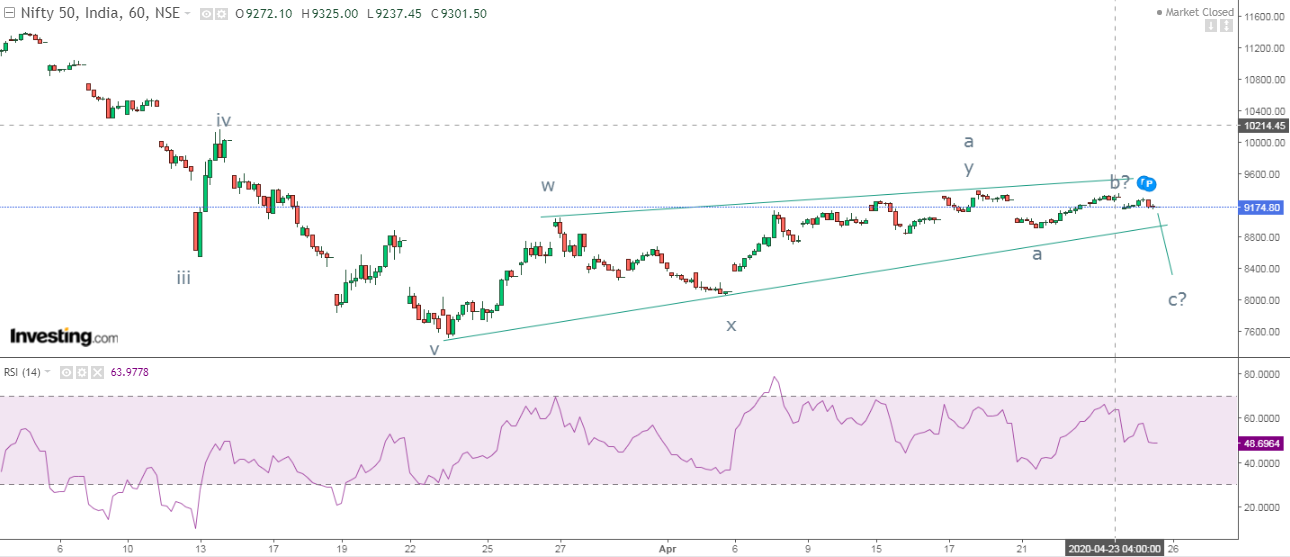
From
hourly analysis, there is no discontinuation of higher highs and higher lows
and so it is difficult to say that the trend is negative, but a move below ... which is the black horizontal line can open negative possibilities.
As
per wave theory, the index has completed wave a in a complex correction and now
it is moving in wave b which can falter till ....% of wave a of one higher degree
which comes to .... levels.
The
summation is, it is imperative to remain cautiously positive for the index, any
move below... can drag it till .... levels in near to medium term.
Learn Elliott Wave and Neo wave in my 1 month course which will be a paid webinar scheduled twice a week, the fees for the same will be Rs. 10,500/-. Call +919324174580 for registration and enquiry.


Comments