Posts

Nifty: what's next as per Elliottwave theory?

Image

GBPINR: ElliottWave forecast

Image
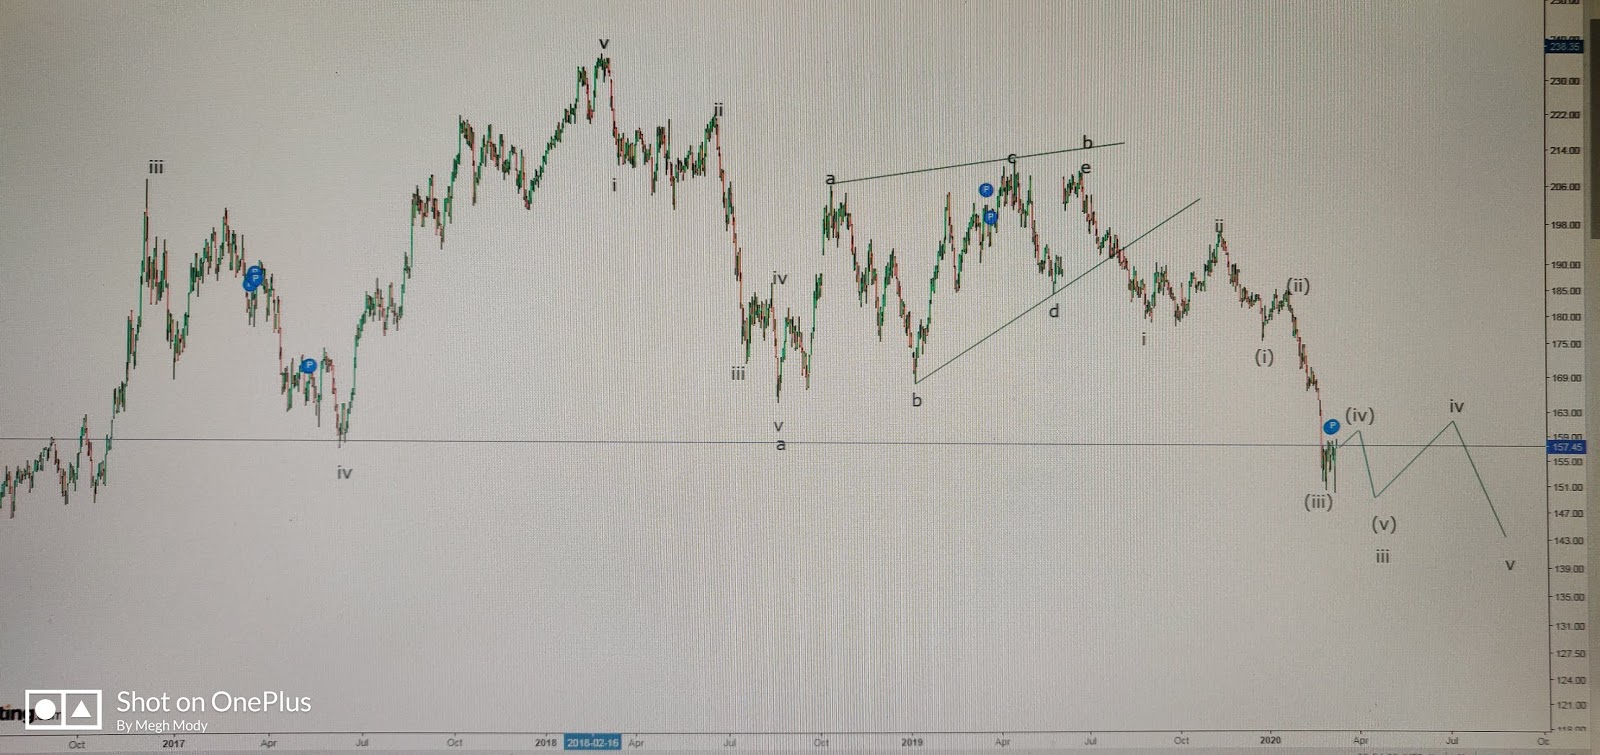
GBPINR continuous daily contract From above chart of GBPINR, prices are trading near the support of the lower trend line. However, this trend line will not give any support but will break it which will infuse selling pressure dragging prices till it’s cluster of supports. As per wave theory, wave c has terminated at 50% from wave a to wave b. At 98.13 prices completed wave b at one higher degree which opens wave c down which can tumble till 92.  Once 92 is breached it can falter till 91 which is 50% of entire wave b. The summation is, prices are firmly in a negative trend and can stumble till 92 followed by 91 with crucial resistance placed at 95.30.

Hang Seng Anticipated Happened video YouTube

Image

MCX Zinc Mini Elliott Wave forecast

Image
MCX Zinc M daily chart Zinc mini is moving in a lower high and lower low formation which is a negative sign. Also to notice prices have give a bearish Head and Shoulder break, this opening negative possibilities. From wave perspective, prices are moving in wave c of wave (a-b-c). Wave c is impulse in nature, in which it is moving in wave iii which is extended. After completing wave (iv) of wave iii it will break it's previous low of 149.90 and complete wave iii then wave iv higher will start which can soar prices near till cluster of resistances placed at 159-160 and then again wave v of wave c will move near till 147-145 range.

Nifty ElliottWave forecast YouTube video

Image

MCX Crude Oil Elliott Wave Forecast

Image
MCX Crude Weekly chart In my earlier articles about Crude Oil I had been mentioning for the level of 3000 down once the level of 3500 was broken. When this level was breached it came down till 2151 after there was no out come from Russia and Saudi Arabia. From ElliottWave analysis, I think that wave b is over in a regular flat pattern which will now open wave c up. This wave c will be impulse in nature and can move till 5600 and complete another way e at one higher degree. Learn ElliottWave and Neo Wave analysis with me in my 4 day course in Mumbai, classroom training available. If you are not in Mumbai webinar is available. The cost will be INR 10,500/- or $155. For registration or inquiry call +919324174580.

Hang Seng Anticipated Happened ElliottWave forecast

Image
Hang Seng Daily chart anticipated on 31st Dec 2019 Hang Seng Daily chart happened on 9th March 2020 In my previous update dated 31st Dec 2019 I was sure enough to say that 29200 will be the capping for this index and thereafter it can falter till 26000-25000 as the entire wave structure is a triangle and moving in wave B in which it has completed wave d and now wave e up will start. Here is the link of my earlier update on Hang Seng https://www.marketanalysiswithmeghmody.com/2019/12/hang-seng-possible-triangle-pattern-and.html Now I am open to 2 scenarios one is the triangle other is w-x-y which is completed and wave c down has started. If triangle then wave e up is pending from hereon.