Posts

Abu Dhabi Banking and Finance and Investment and finance index

Image
Daily chart of ADXBF Daily chart of ADXFS From the above first chart, ADXBF is possibly trading in a running triangle pattern which is completed and wave v will start surging prices till 11100 levels, this will complete wave iii then it will correct in form of wave iv which can go below 10000 and after that wave v at one higher degree can start, may be at 11700 levels. In the second chart, a perfect A-B-C pattern is completed which will either open fresh leg up or possbiliy of a complex correction. In both cases chances are high for prices to move up near till 1800. Learn Technical Analysis course, a 4 month course scheduled every Sunday for over 3 hours for in-depth understanding of markets. ElliottWave NeoWave Classroom training and webinar training is also available which will be 4 day course and the fees will be RS 10500/- or $155. For inquiry call +919324174580

USDINR: Change in wave counts but not the view

Image
USDINR Fut Contract (Jan) In my previous update I had mentioned that USDINR will move till 73-73.5, however, it reversed from the supply zone of 72.5-72.8 levels. This is an indication that a range bound move is on its way. Recently it bounced from the support of the range and I also think that it could be a completion of complex correction pattern. (w-x-y-x-z). I have to change my wave counts but my view is as usual bullish which can soar prices near till 73-73.5 in near to medium term. Learn Elliott Wave and Neo Wave in 4 days for the cost of 10500/- Rs or $155 for inquiry and registration contact +919324174580. Classroom training and webinar both are available.

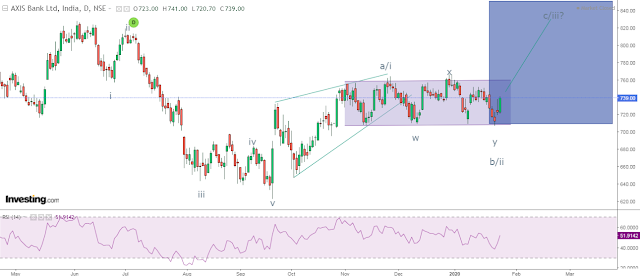
Axis Bank: Bounce from the support and Elliott Wave Analysis

Image
Axis Bank Daily chart Axis Bank is moving in a sideways pattern (marked purple color), this range is of 60 points from 705 765. Prices persists in this range, as far as it does no trending move is expected. recently its quarterly results were announced which was robust. Prices bounce from the lower end of the support range which and is now moving towards 765. As per wave theory, prices are moving in wave b/ii, once this is complete wave c /iii will open which can surge price to 820-830 levels which is 100% of wave a/i, which is in leading diagonal formation. Learn Elliott and Neo Wave with e in a 4 day course which will be a classroom training or a webinar. The cost will be Rs 10500/- or $155. For inquiry contact +919324174580.

Glenmark pharma: Elliott Wave forecast

Image
Glenmark daily chart This pharma stock has been underperforming in 2019 but off recently it has shown signs of resilience. I was too optimistic for metal and now for Auto but it seems that pharma will start surging in 2020. I have placed manual wave counts and came to a conclusion that this stock is set to soar near to it's resistance level. As per wave theory, prices have completed a-b-c  pattern an has started new leg up. It is too early to say if it's reversal or just a bounce back, so I am expecting the latter one. This pharma stock is poised to move till 480 levels from current juncture. Learn ElliottWave and Neo wave with me in my 4 day course which will cost RS, 10500/-. For inquiry and registration call +919324174580.

Maruti Suzuki: ElliottWave Forecast

Image
Maruti Suzuki daily chart I was bewildered when I first saw this chart, but later when I started calculating the wave counts it felt that it is so perfectly poised to soar. Here I present you the wave counts of Maruti Suzuki. Before you read the explanation, I am here to announce that you all can learn ElliottWave and NeoWave analysis with me which is set to start in February 2020. This will be a 4 day course and the fees will be RS. 10,500/- for inquiry call +919324174580 In the first half of the chart vertically you can see an impulse rally where in wave v was truncated. Also after that wave a-b-c was have a Fibonacci connection where wave c was 61.8 of wave a. Now fresh leg on the upside has started where in wave i i los to be a leading expanding diagonal and wave ii retraced 38 .2% and now wave iii has started which looks to be extended. Now minimum criteria is 100% of wave i, which means wave iii can go till 9200. But the rule of extension says that it can advance near

Nifty Auto: Short to medium term forecast

Image
Video Learn Technical Analysis course starting from 9th Feb 2020. A four month course which will cover from basics to advance technical analysis. For inquiry and registration call +919324174580

Tata Steel: Using Technical tools

Image
Video Learn Technical Analysis, a four month course where it will start from basics to advance concepts and making you understand the importance of risk management along with investment and trading purpose. For inquiry call +919324174580.