Posts

MCX Aluminium to shed some recent gains

Image
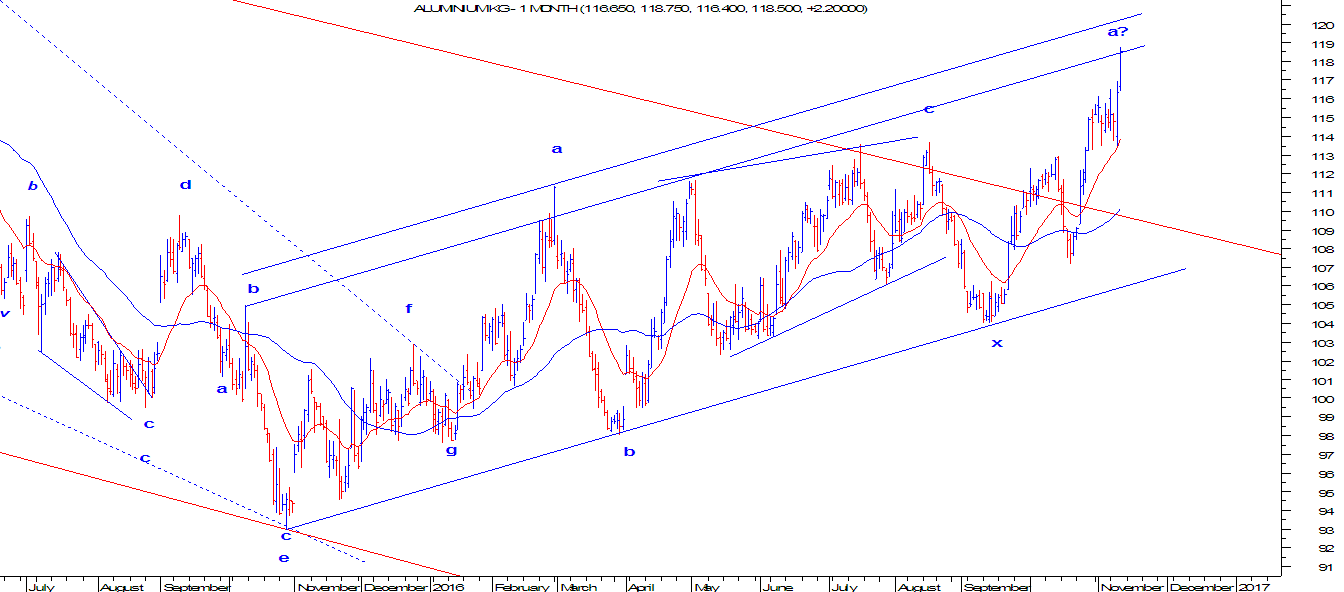
From the below chart of MCX Aluminium, it started its upward journey after forming a bottom in October 2015 and thereafter it is moving precisely in a rising channel formation, this gives an indication that the trend is positive. Moving averages are also showing positive action. However, prices have arrived near the resistance of the channel which can eventually lead to a short term reversal. As per wave patterns, it is clearly visible that prices are as of now moving in a double correction (a-b-c-x-a-b-c). At current juncture it has completed or in a process to complete wave a of the second correction. Wave a can also exceed till 120 - 121 levels. Following there has to be a good reversal which will start wave b on the downside. In short, expect prices to move down till 110 levels for short term. The major trend will continue to be positive as far as prices persist in the rising blue channel.

SBI: Head and Shoulder, Neo Triangle

Image
SBI was forming a topping process from the month of August 2016 till November 2016. The topping process ended in a head and shoulder formation supported by volume. The left shoulder was accompanied by heavy volume but as the pattern started forming the volume receded. The level of 245- from where prices have bounced couple of times was breached, giving an indication the lower tops are in place. Short term moving averages have given a bearish crossover which supports my above mention view. As per wave analysis, prices formed a extracting triangle at the top and then moved down thereby ending wave y at the top. One complex correction was ended from the bottom to top and now its correction will start on the downside. As far as prices don't move above level of 256, the bias will remain negative for this banking stock. According to H&S pattern, prices can touch the level of 220. SBI Daily Chart Disclaimer: The above content is not for trading perspective. Plea

Crude Oil: Reversal ahead of inventory

Image
WTI Crude, yesterday tumbled more than 2% moving below $50 as inventory consensus indicates that there will be a surge in it. The inventory will be released today and the forecast is 0.7m which is more than the previous reading of (5.2m).  The reversal in prices was anticipated way to early before the inventory readings. Prices also started moving down breaching its previous day low thus giving an indication that a counter trend has started. The up move from 2873 (MCX) till 3464 (MCX) from September till start of October where prices moved in a higher high and higher low formation has been discontinued by breaching the level of 3306 which happened today. As per Wave theory, the (ii-iv) line has been broken giving an indication that wave v is in place and prices will now move in a negative direction. I am expecting that an immediate top is in place and prices can move down till 3200 followed by 3100, thus breaching the (0-b line) which will confirm that wave b is in place or i

MCX Crude: Still downside intact?

Image
Bechmark Crude oil is failing to move above $49 thus making that level an overhead resistance and the level of $44 as an underlying support. As inventories keep on adding and subtracting prices continue to move in a above mentioned range. MCX Crude from the low of 1805 moved up drastically to the level of 3439 from February to June, thereafter, prices started moving in a counter trend. Counter trend is normally an interruption of main trend. As of now, prices continue to move in this counter trend as the wave are sub-divided. From wave perspective, prices moved in a five wave structure which can be wave 1/a as of now it is moving in either wave 2/b in which wave a was a impulsive and wave b is in a triangle and completing at 61.8% of wave a of wave 2/b. Wave c is due and can move down near to its previous low placed at 2631 which is the end of wave a. In short, the bias is firmly negative for MCX Crude Oil as it is expected to test 2650-2600 levels. However, if prices mov

MCX Zinc: Ending Diagonal and reversal

Image
MCX Zinc which surged from the lows of 96.65 and touched till 157.85 levels this month is now going to end its up move and the possibility of a stealth bear trend will start in this metal. As per wave perspective, after making the low of 96.65, prices moved up in a three wave structure (a-b-c) in which wave a completed at 124.50 and wave b which ended in a complex structure at 122.55 levels. Wave c which was an impulse structure in which wave iii was extended and wave v completed by forming a ending diagonal pattern. After completing the ending diagonal pattern, prices are now moving lower. I think the trend has changed and prices are poised to move lower. The immediate support is at 145 levels which is the support of the channel. Break of this channel will infuse further selling pressure in this metal dragging prices lower till 135-138 levels. MCX Zinc Daily chart (1st month continuous contract)

MCX Copper: Change in trend

Image
MCX Copper, from start till date of this year is moving in a range of 300-340 levels. Last expiry the red metal closed at 305 levels and in current series prices are trading above 310 levels. The demand for this metal will increase if the largest importer of the world will start improving. However, technical indicators are giving a clue of a possible trend change. Prices tested the cluster of supports at 305 and moved in a falling channel. The declining channel was broken yesterday when prices closed above 312 levels. Secondly, the peak of 310.65 was taken out at faster time and can possibly be a reversal. However, the metal is not trading above any of the short term moving averages.  As per wave theory, prices might have completed a sideways correction in a form of triangle pattern and has started moving higher which is commonly known as a 'thrust'. The thrust can be an impulse or a corrective but the possibility for prices to move higher is much likely. In short

IDFC: Expanding and Contracting Diametric

Image
IDFC is moving in a positive direction from  March 2016. As of now it has protected the upward sloping blue line which is drawn from the bottom of March till date. I strongly believe that the trend lines are always meant to be broken- it is time for short term trend to change. Technically speaking, the stock have started exhibiting negative divergence in comparison with momentum indicators such as MACD, RSI etc. This is the first indication that the positive momentum is on the brink to diminish and prices are now expected to reverse. The first confirmation will be obtained when the level of 54 is broken on the downside. As per wave theory, from end of March till date, prices are moving in a complex correction. The first pattern which is a seven legged pattern (a-b-c-d-e-f-g) is a diamond shape diametric immediately followed by wave x, then there is a bow and tie diametric pattern which also has seven legs in it. Now the possibility of wave x on the downside is higher or bigge