Posts

MCX Zinc: Ending Diagonal and reversal

Image
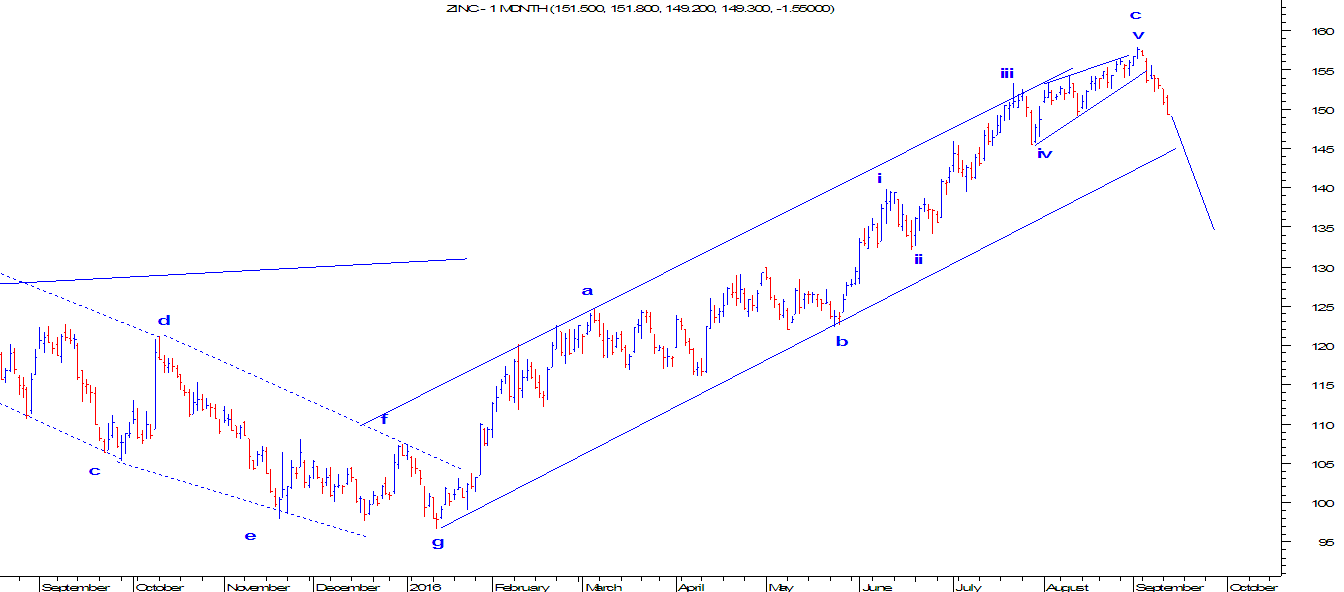
MCX Zinc which surged from the lows of 96.65 and touched till 157.85 levels this month is now going to end its up move and the possibility of a stealth bear trend will start in this metal. As per wave perspective, after making the low of 96.65, prices moved up in a three wave structure (a-b-c) in which wave a completed at 124.50 and wave b which ended in a complex structure at 122.55 levels. Wave c which was an impulse structure in which wave iii was extended and wave v completed by forming a ending diagonal pattern. After completing the ending diagonal pattern, prices are now moving lower. I think the trend has changed and prices are poised to move lower. The immediate support is at 145 levels which is the support of the channel. Break of this channel will infuse further selling pressure in this metal dragging prices lower till 135-138 levels. MCX Zinc Daily chart (1st month continuous contract)

MCX Copper: Change in trend

Image
MCX Copper, from start till date of this year is moving in a range of 300-340 levels. Last expiry the red metal closed at 305 levels and in current series prices are trading above 310 levels. The demand for this metal will increase if the largest importer of the world will start improving. However, technical indicators are giving a clue of a possible trend change. Prices tested the cluster of supports at 305 and moved in a falling channel. The declining channel was broken yesterday when prices closed above 312 levels. Secondly, the peak of 310.65 was taken out at faster time and can possibly be a reversal. However, the metal is not trading above any of the short term moving averages.  As per wave theory, prices might have completed a sideways correction in a form of triangle pattern and has started moving higher which is commonly known as a 'thrust'. The thrust can be an impulse or a corrective but the possibility for prices to move higher is much likely. In short

IDFC: Expanding and Contracting Diametric

Image
IDFC is moving in a positive direction from  March 2016. As of now it has protected the upward sloping blue line which is drawn from the bottom of March till date. I strongly believe that the trend lines are always meant to be broken- it is time for short term trend to change. Technically speaking, the stock have started exhibiting negative divergence in comparison with momentum indicators such as MACD, RSI etc. This is the first indication that the positive momentum is on the brink to diminish and prices are now expected to reverse. The first confirmation will be obtained when the level of 54 is broken on the downside. As per wave theory, from end of March till date, prices are moving in a complex correction. The first pattern which is a seven legged pattern (a-b-c-d-e-f-g) is a diamond shape diametric immediately followed by wave x, then there is a bow and tie diametric pattern which also has seven legs in it. Now the possibility of wave x on the downside is higher or bigge

MCX Lead: Bullish channel breakout

Image
Remember a channel breakout is a first indication that prices are about to change the direction. Prices which are moving in a falling channel changes the trend once it takes out the upper downward sloping trend line. MCX Lead has given a bullish break in a falling channel, thus opening positive possibilities. This gives a clear picture of basic technicals. As per advance technicals i.e. wave theory, Lead after completing diametric pattern at 107.15 where 'g' is marked moved higher thereafter in a corrective pattern. Corrective pattern has three legs in it. Wave a was a complex one, wave b completed in a running flat pattern and wave c is now open and can move higher in a five wave structure. In short expect prices to move higher till 133-135 levels in near term as far as 125.30 is intact on the downside. MCX Lead Daily chart (1st month contract)

USDINR Revisited

Image
My last update on USDINR dated on 26th May 2016 (here is the link:  http://marketanalysiswithmeghmody.blogspot.in/2016/05/usdinr-possible-triangle-in-making.html ) I had mentioned that the two year rally is on the way to exhaust and probably it is making a topping process in the form of triangle pattern. On global front, Dollar index which came under pressure this month amidst release of downbeat data has accelerated selling pressure making it tumble from 97 to 94.00 odd levels. It has also turned down the probability of one rate hike from FED this year. USDINR, finally broke the channel thus opening negative possibilities. Prices are also facing difficulty to trade above both the short term moving averages. The direction of the moving average is also facing downward thus giving an clear indication that the trend is down.  In my previous update (the link shared above), I came up with an assumption that the topping process is probably a Extracting triangle or a Symmetrical

Stealth Bear trend for USDJPY

Image
USDJPY Daily Chart After winning the upper house election Prime Minister of Japan Shinzo Abe reiterated to add more stimulus to revive the ailing economy. Market participants were expecting 10 trillion yen for this fiscal but the efforts by BOJ could not meet the expectations. USDJPY which was moving in a higher high and higher low from the start of 2012, changed the trend by discontinuing the positive formation in the month of November 2015. Thereafter, prices are moving down by breaching its previous lows. From wave perspective, after completing five waves on the upside and marking a high of 125.85 in the month of April 2015, prices have started moving in a corrective mode. The corrective mode normally takes more time before the next rally starts. As of now it is moving in a double corrective pattern, in which it has completed wave b of second corrective and wave c on the downside will start, dragging prices lower below 100. In short, bear trend for USDJPY has

MCX Zinc: Anticipated Happened and Wave Analysis

Image
MCX Zinc  Anticipated on 1st June 2016(1st month Daily chart contract) MCX Zinc Happened on 1st July 2016 (1st month Daily chart contract) In my previous update dated on 1st June 2016, I had mentioned that " The bias for MCX ZINC remains positive as it can test 143 levels only if it sustains above 132 for considerable time" Zinc crossed the level of 132 and moved higher till my mentioned level of 143 which is 80% retracement of the previous fall. This gives an indication that the metal is moving in a flat pattern. However, the 80% retracement can also be extended till 100% or 123.6% of the previous fall, eventually ending it with regular or irregular flat pattern. It is imperative for prices to reverse sharply which will be the first indication that wave b of flat is over and wave c has started on the downside. As of now the bias remains positive for this metal.