Posts

Comparison of 2 Indices -reveal the answers for the next trend.

Image
Yes, you heard it right by comparing 2 main indices you can know what will be the next trend for the Indian Equity Markets. By comparing Nifty with Bank Nifty we found out some facts which signal some shocking revelations. Indian Equity Markets has picked up tremendous pace from past 2 months due the major event lined up (election). Now the question arise how far this euphoria sustain? Well many stock market participants are now turned extremely bullish and are coming with targets of 7500-7800 for Nifty. We will take this as a negative signal as when crowd thinks in one way, markets attune to give a different conclusion. Lets come back to the comparison, Nifty has made a all time high of 6776 which was made on 3 rd Of April 2014, but Bank Nifty has not even managed to cross its previous high of 13281 which was made in 2013, this is a classical negative divergence between two indices which suggest that it is implicit to be cautiously positive at current juncture. We

Australian Securities Exchange (ASX): Elliott Wave Counts and Forecasting

Image
The Australian Securities Exchange (ASX) is Australia's primary  securities exchange . It was created by the merger of the Australian Stock Exchange and the Sydney Futures Exchange in July 2006. Today, ASX has an average daily turnover of $4.685 billion and a market capitalisation of around A$1.4 trillion, making it one of the world's top-10 listed exchange groups, comparable to the  New York Stock Exchange ,  London Stock Exchange  and  Deutsche. Elliott Wave Analysis has always helped to know the forthcoming trend in any asset class and that is why it is world renowned theory. We have applied this theory in ASX to know what is next for this index. Using Elliott Wave and other technical indicators like moving averages, MACD etc with technical tools like channels, retracements helps to know the possible support and resistance levels.  In the below daily chart of ASX, the index is moving up precisely in an upward sloping blue channel which is positive sign. The f

BHEL: Bearish Breakout and Elliott Wave counts

Image
Capital goods stock has always been in demand as it was the only sector which was outperforming when Nifty was trendless. When Nifty started to pick up momentum Capital Goods stock like BHEL, LT etc crossed its previous pivot highs thus opening up positive possibilities. Recently positive momentum in this sector seems to be slowing down which is not a health sign. We have applied Elliott Wave counts in BHEL to understand the trend in this stock and the possible support using simple technicals. The below excerpt is been picked from our daily research report “The Equity Waves” where we had mentioned that BHEL has given a negative break. As shown in the daily chart of BHEL, prices were moving up with great strength after making a low of 145 in the month of February 2014 which enabled prices to cross its previous high of 181 and made a new high of 202 recently, but from past 3 trading sessions prices are moving down by breaching its previous lows which is not a healthy sign

Crude Oil: Trading with Elliott Wave and Price ROC

Image
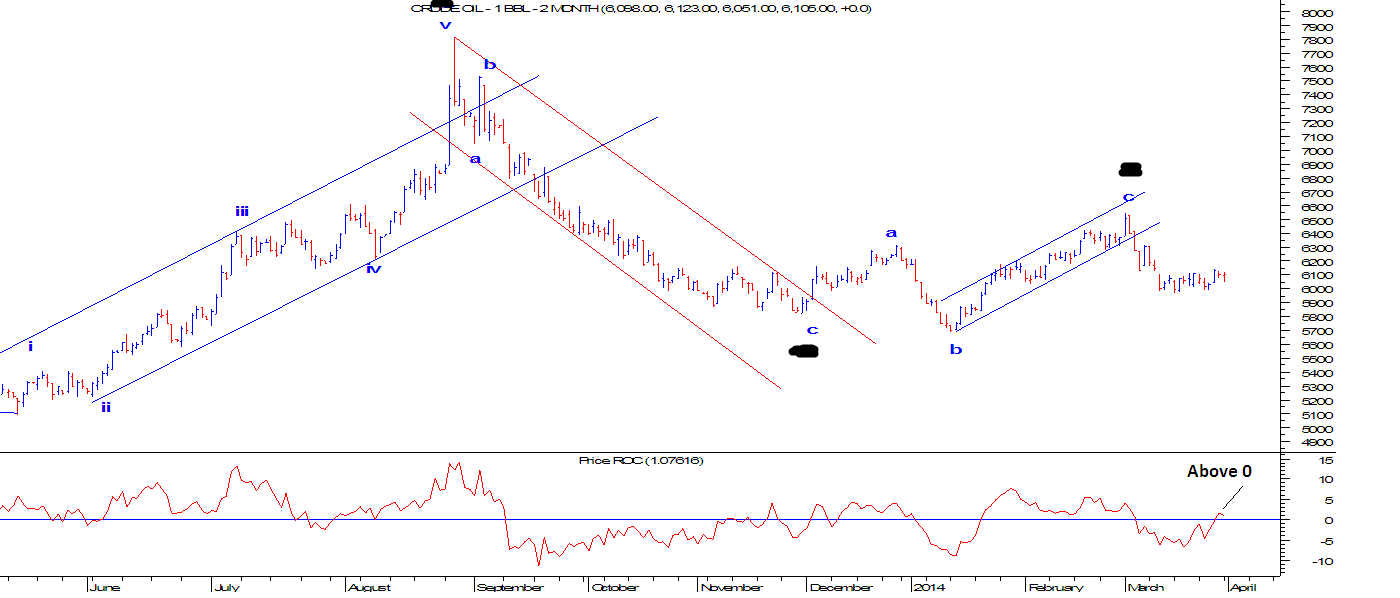
Crude oil has been very volatile after making low in November 2013. Prices then started to move in a very big range of 6500-5980 levels. Using Elliott wave analysis we came with a view that there is still a big possibility that Crude oil will still respect this range or this range will contract as time passes by. From the below daily chart we have used Elliott Wave analysis to identify the next possible move in Crude oil. As we had mentioned that it is moving in a range, prices has bounced from the lower end of the extreme and can move up from current levels. Again the entire month of March it consolidated in a very stiff range and has probably started the up move. Price ROC has also moved above the equilibrium i.e 0 which opens positive possibilities. As per Elliott wave theory, prices are moving in a corrective form where it has completed ……….. In short, …………………………….

Nifty: Moving in a Channelized Formation

Image
Nifty started gaining momentum especially after making a low of 5985 and moved up till 6723 levels in a span of one and half month and made a record high. This up move is very much similar to the move which occurred from December 2011 till February 2012 (marked by blue rectangle) where the index gained tremendously in spite of RSI staying in over bought zone for many weeks. This scenario is similar for the current rally as well, but how long this up move will sustain? Even with the help of simple technical analysis like channels, retracements etc and use of candlestick patterns, traders can easily understand resistance and reversal signals. Channels are two parallel lines which helps to know the support and resistance levels. From past 3 years Nifty is moving in a channelized formation. The formation is positive as it is making a higher high and higher lows, but on 31 st March 2014 prices faced the resistance of the upper trend line of the channel and has also formed a han

JP Associates: Elliott wave counts and Forecasting.

Image
Infrastructure conglomerate   Jaiprakash Associates   signed an agreement to   sell   its 74 per cent stake in a   cement  manufacturing unit in Bokaro to   Dalmia Cement   (Bharat) for a   deal  that values the entity at around Rs1,150 crore. The proceeds of the   stake sale   will help Jaiprakash Associates in its plan to cut the Rs60,000 crore debt  on its books. It wants to slash debt by Rs15,000 crore by March end. In a  disclosure  to bourses, Jaiprakash said it will sell its entire  holding  of 74 per cent in the Bokaro  unit , of which   Steel Authority of India   owns 24 per cent, at Rs69.74 per share, which translates to about Rs690 crore for the stake. "The above stake  sale  is subject to the approval of   SAIL   and such other  approvals , as may be necessary from  lenders  of Bokaro Jaypee Cement and concerned authorities," Jaiprakash Associates said. Besides the equity investment , Dalmia Cement will also take over around Rs250 crore of debt attache

Reliance Communications: Near Completion of Channelized Move and Elliott Wave Counts.

Image
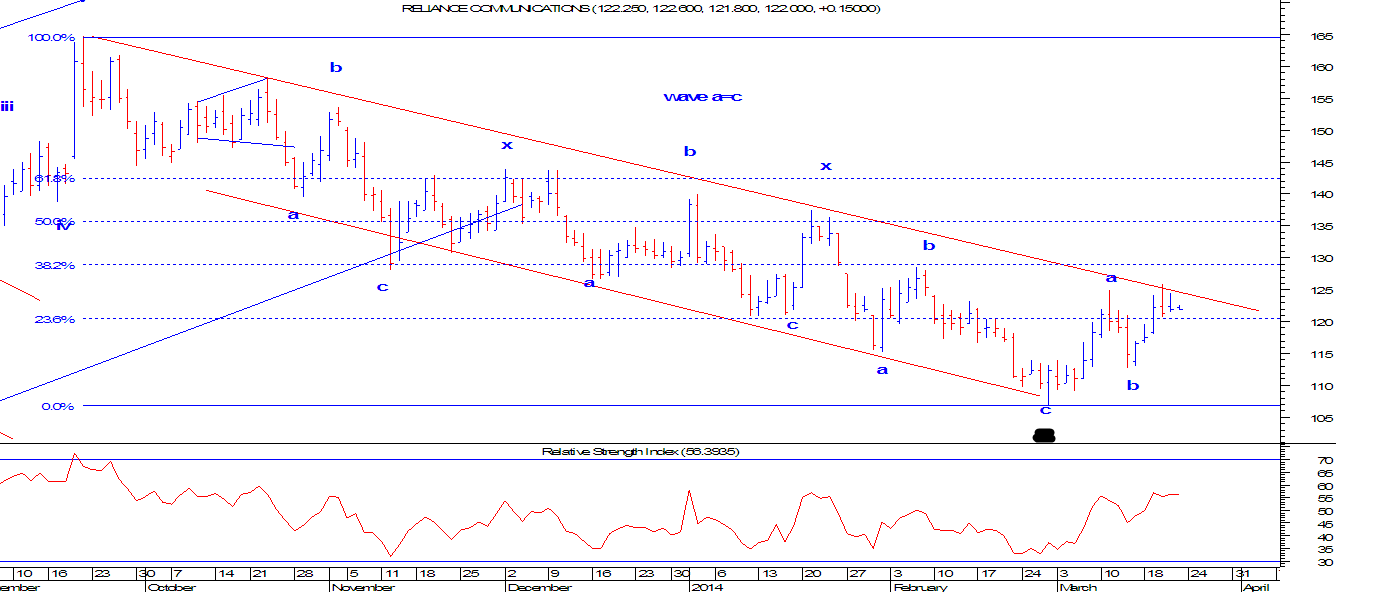
Telecom is one of the underperformer sector as compared to other sectors such as Banks, realty, MNC’s etc. This means the entire telecom pack which includes Bharti Airtel, Rel Com, Idea, Tata Com has not performed in sync with Nifty. We are going to discuss on Reliance communication as this stock has failed to show any positive momentum from past 6 months. It is not acceptable for this high beta stock to underperform even when Nifty moved up almost 1300 points on the upside in last 6 months. By applying the combination of basic technical analysis and Elliott wave theory it becomes easy to forecast the upcoming trend for a particular asset class. Simple technicals like channels, retracements etc help us to know the possible support and resistance for the asset class. From the below daily chart of Reliance communication, we can see clearly that prices are moving down after making a high of 164.65 on 20 th November 2013. Thereafter it failed to move above its high and sta