Crude Oil: Trading with Elliott Wave and Price ROC
Crude oil has been very volatile
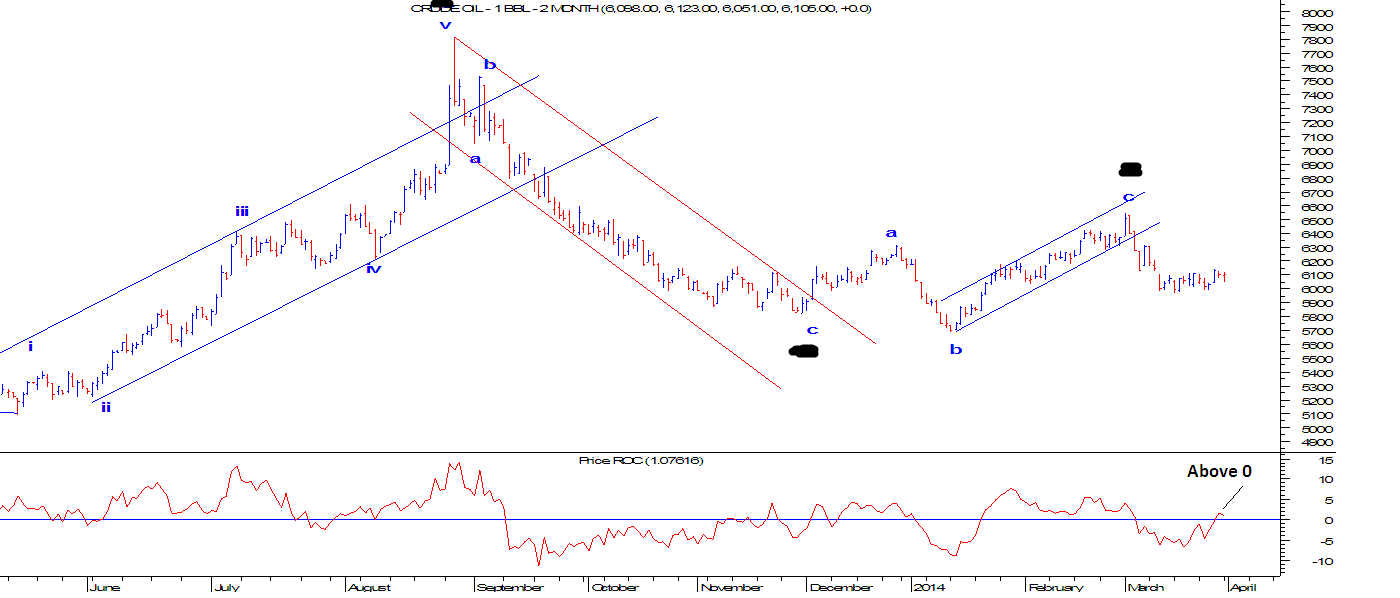
after making low in November 2013. Prices then started to move in a very big
range of 6500-5980 levels. Using Elliott wave analysis we came with a view that
there is still a big possibility that Crude oil will still respect this range
or this range will contract as time passes by.
From the below daily chart we
have used Elliott Wave analysis to identify the next possible move in Crude
oil. As we had mentioned that it is moving in a range, prices has bounced from
the lower end of the extreme and can move up from current levels. Again the
entire month of March it consolidated in a very stiff range and has probably
started the up move. Price ROC has also moved above the equilibrium i.e 0 which
opens positive possibilities.
As per Elliott wave theory,
prices are moving in a corrective form where it has completed ………..
In short, …………………………….


Comments