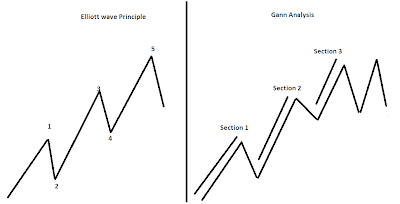
Elliott Wave Principle

We all know the importance of Technical Analysis and how it works in today’s market. Technical tools like channels, Fibonacci retracements and oscillators like RSI, MACD etc do give us signals for when to buy and sell. Combining simple technicals along with advance technicals like Elliott wave and Gann Analysis always keep us one step ahead of the market movement. Advance technical eradicate subjectivity and helps to take proper trading decisions. Today we shall see some important concepts of Elliott Wave theory. In 1920 R.N. Elliott invented this theory and named Elliott Wave. He observed that there are thirteen patterns or waves that recur in market price data and are repetitive in form, but are not necessarily repetitive in amplitude or time. We will now discuss some important concepts of Elliott wave theory R. N Elliott has discovered 2 types of waves in the market 1. Motive or Impulse wave 2. Corrective Wave 1. Motive or Impulse waves Elliott said that