PSU Banks Index
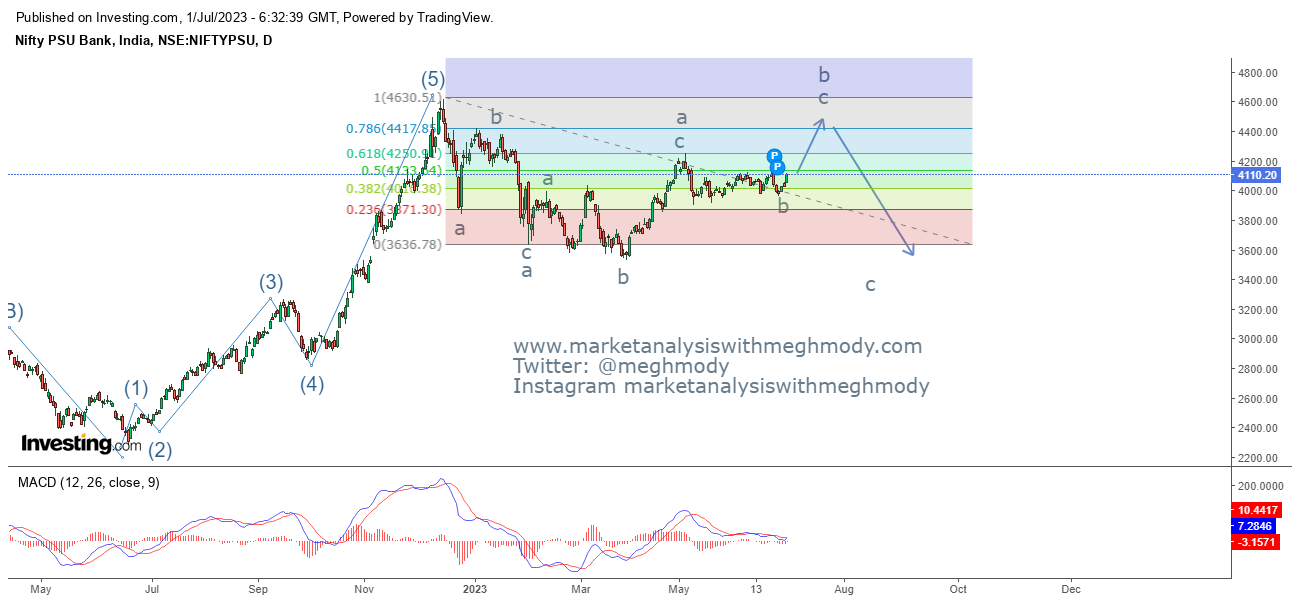
PSU Bank Index daily chart
Analysis
As seen in the above daily chart, prices are moving in a sideways direction particularly in the range of 3600 on the lower side and 4600 on the higher side. Currently, the index is trading at 4110 levels and there is a high possibility that the benchmark can travel towards the upper extreme. MACD is on the brink to give a buy signal which is in sync with the positive view.
From Waves perspective, the index is moving in a flat pattern (3-3-5), in which it is moving in wave B which can travel towards 80-100% of wave a which is placed at 4420 - 4630 levels respectively. In wave b wave a and wave b is over and wave c will start which will be impulse in nature.
The summation is PSU Banks Index is positively poised can can travel towards 4420 levels over short term.
Join my Telegram Channel : https://t.me/elliottician1
Join My Twitter handle : https://twitter.com/meghmody?


Comments