Axis Bank Elliott Wave Forecast

In
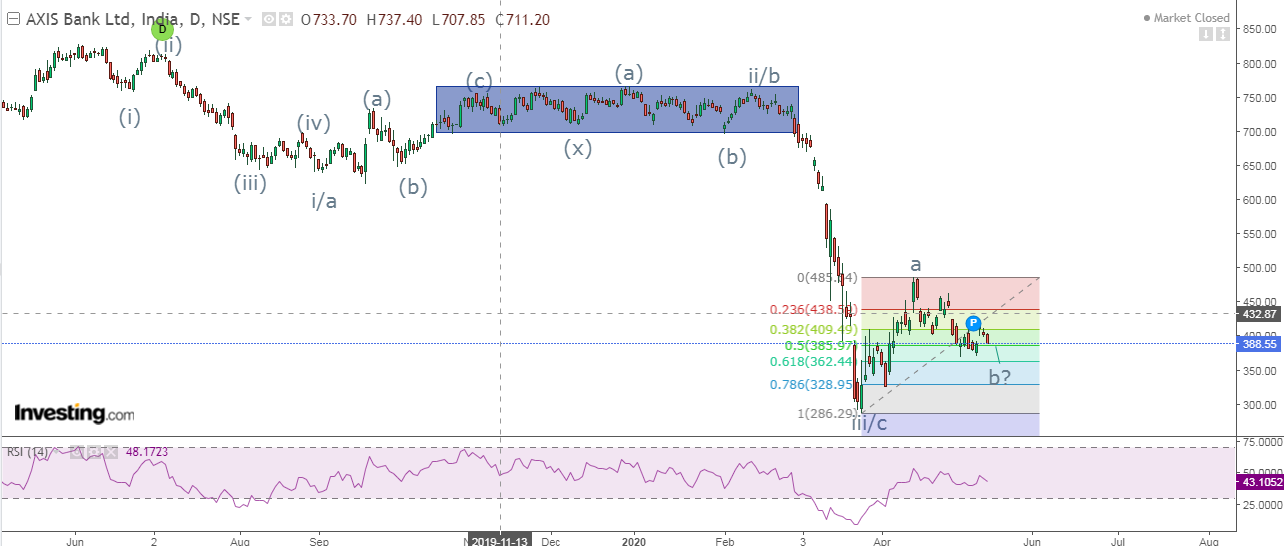
the above daily chart it is very clear that prices are making lower highs and
lower lows, which is a negative sign. After making a low of 287 prices managed
to bounce till 486 levels after that it continues to move in the major
direction which is negative. Daily RSI has failed to cross the center line from
below and is showing signs of reversal.
From
hourly chart, the banking stock is moving in a falling channel, which is a
negative sign. As of now it is showing signs of reversal from 420 levels which
is closer to the trend line resistance. It has also filled the rising gap
(marked by rectangle) on Friday which is a negative sign indicating that bulls
are losing control.
Wave
theory says that, Axis Bank is moving in a complex correction pattern from the
hourly chart pattern, this means that it has completed one correction after
wave a at one higher degree was completed and then wave (x) was formed near 420
levels and now second correction is on the wave which can be 61.8% to 80% of
the rise to complete wave b at one higher degree.
The
summation is, prices are poised to falter till 360-355 levels where the support
of the channel is placed with resistance at 410.
Elliott
and Neo Wave analysis is conducted for 1 month, this is an advance technical
course suited for professional traders. Twice a week, 2 hours will be given for
theory as well as practical application. The fees for it will be Rs. 10,500/-.
Classroom
training and webinars both are available. If you reside in Mumbai, classroom
training is conducted in Vile Parle near station and Borivali Station. For
inquiry and registration call +919324174580.


Comments