USDINR: Enough depreciation
USDINR daily chart
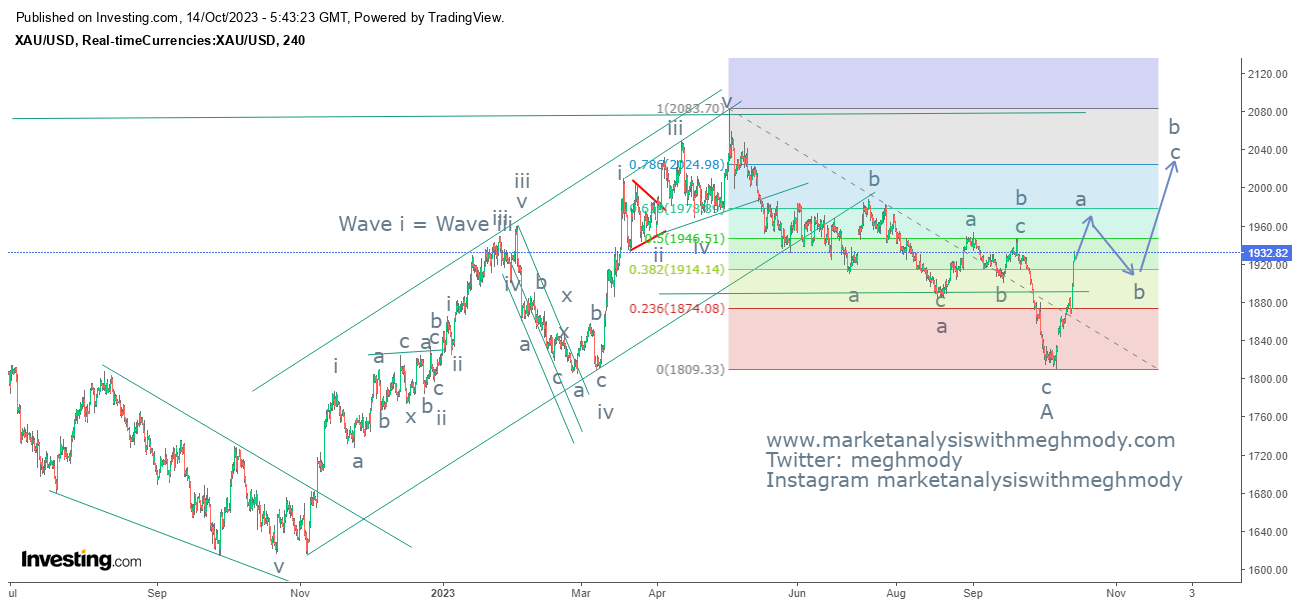
USDINR has been continuously depreciating from past two months. after making a high of 71.9 in the month of February 2019. However, the depreciation will not intensify and there are high chances for prices to reverse in coming weeks.
After completing wave a in flat pattern, prices are moving in wave b which is an irregular flat pattern. In which wave b dipped below the start of wave a and completed at 68.34. Currently prices are moving higher in wave c. This wave c can go higher till end of wave a.
It is likely prices can move up till 72 levels in near term as far as the level of 68.4 is intact on the downside.
It is not difficult to predict the market by using advance technical analysis, but it is difficult to understand advance technical analysis. All you need to do is mail me at meghmody@gmail.com and subscribe to my two day paid seminar. In these two days you will learn the concept of Elliott Wave and Neo wave, combination of price and time, how to anticipate, tools required to anticipate the rise and fall of price. It is better not to follow the crowd blindly and think objectively before taking a trade. The cost of this seminar is 10000/- per person.
It is not difficult to predict the market by using advance technical analysis, but it is difficult to understand advance technical analysis. All you need to do is mail me at meghmody@gmail.com and subscribe to my two day paid seminar. In these two days you will learn the concept of Elliott Wave and Neo wave, combination of price and time, how to anticipate, tools required to anticipate the rise and fall of price. It is better not to follow the crowd blindly and think objectively before taking a trade. The cost of this seminar is 10000/- per person.


Comments