MCX Gold set to slide (Elliott Wave Analysis)
MCX Gold (Daily Continuous contract)
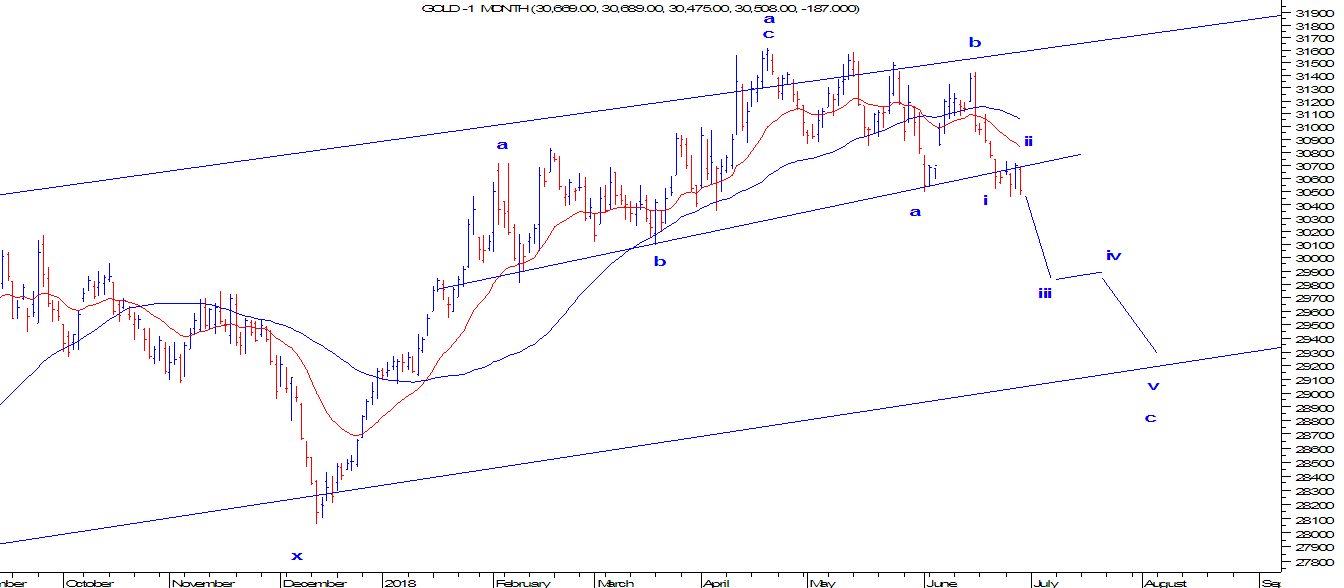
From the above chart of MCX Gold, it is very clear that the trend is now negative as prices reversed from the channel resistance and is now moving in a lower high and lower low formation. Prices also formed a topping process by making a bearish Head and Shoulder pattern. This pattern is completed as the neckline is breached, placed close to 30,700.At present, the yellow metal is hovering near the neckline and can move down from current juncture.
As per wave theory, prices is set to move down in one higher degree of wave b in which it has completed wave a and wave b. So the possibility of wave c is open on the downside which is impulse in nature or it can end up in a diagonal.
In short, MCX Gold is set to dip near to 30,000 followed by 29500 where the channel support is placed over short to medium term.


Comments
MNC Stocks