MCX Crude poised to test 2500?
MCX Crude which was moving in a declining channel has finally given a positive breakout. However, prices still face a hurdle of 2350 levels.
RSI on daily chart has also exhibited positive divergence which indicates that prices are poised to give some resilience.
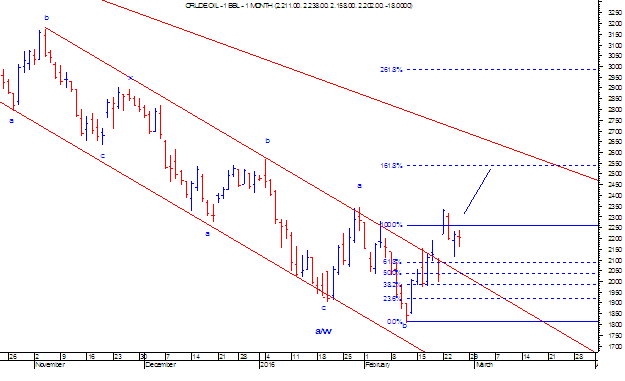
From Wave perspective, the first correction was a double corrective pattern (a-b-c-x-a-b-c) which was completed at 1902 levels. The current up move as of now is a (a-b-c) pattern. Where wave c has unfolded. This current b wave is in irregular flat pattern which has (3-3-5) waves in it. As per Fibonacci projection, the last leg of irregular flat pattern can extend till 161.8% of wave a and b, which is place at 2532.
In short, a classical channel bullish channel breakout followed by throw over indicates that momentum on the up side still persist. Prices can test the level of 2500 over short term.
MCX Crude Daily chart 1st month contract


Comments
KHAITAN CHEMICALS & FERTILIZERS