Tech Mahindra: Bollinger Bands and Elliott Wave Counts.
Tech Mahindra, on June 25, 2013 announced the completion of Mahindra Satyam’s
merger with itself. Post-merger, the new entity becomes the fifth largest IT Company
in the country with revenues of $2.7 billion. Combined
entity has a team of 83,000 professionals, servicing 540 customers across 49
countries. It has 15 overseas offices for BPO (business process outsourcing)
operations and software development. Its revenue for 2012-13 was put at $2.7
billion (Rs. 16,000 crore).
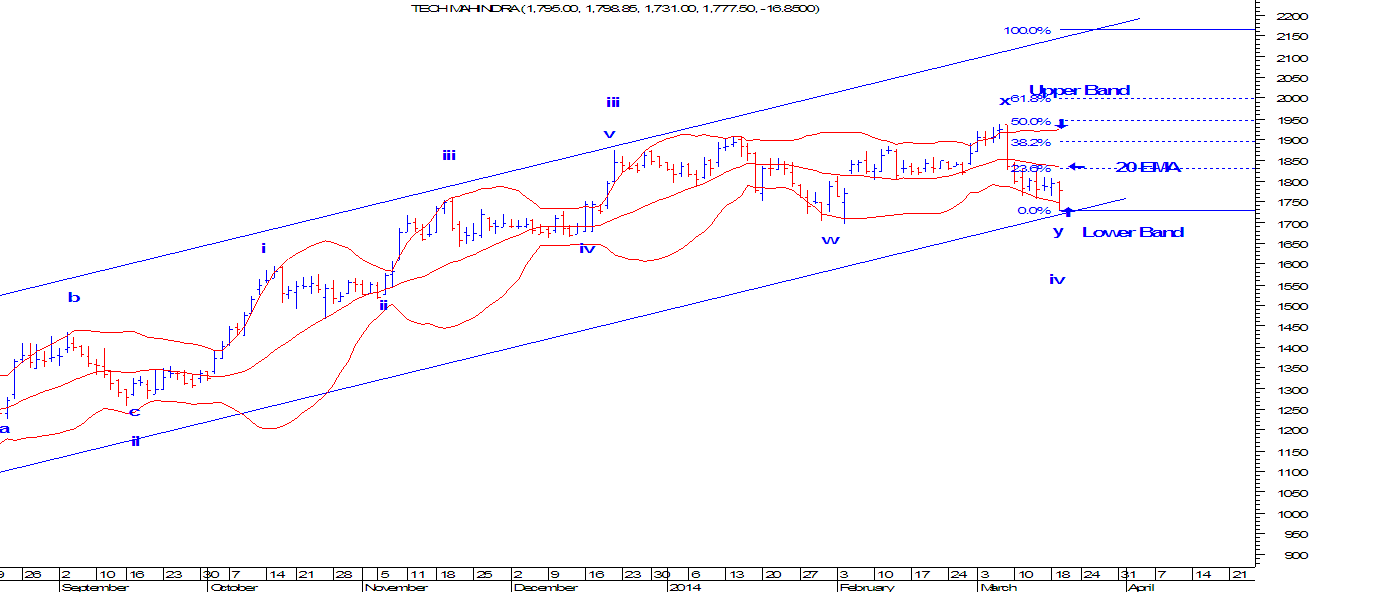
Technically,
it is very clear from the below daily chart that the stock is moving up by
forming a higher highs and higher lows and it is moving in an upward sloping
blue channel which is a healthy sign for this IT stock. On 19th
March 2014, the stock was down but it bounced lately which clearly suggests
that there was a buying seen.
Using
Bollinger Bands has always helped to understand the range of the asset class.
These are self adjusting bands and are very helpful in a range bound market. In
this stock, prices bounced from the lower band and is now moving up to its
median i.e. 20 EMA. It can also move till its upper band which is somewhere
near 1950 levels. This indicator helps traders to buy near the support and sell
at the resistance or vice-versa.
From
wave perspective, prices are moving up in an impulse fashion. This means that
it has 5 legs on upside. Recently, we think that it has completed wave iv at
1731 and it is now moving up in the form of wave v which is the last leg. The
stock can move till 2000-2050 levels over short term.
In
short, our bias for Tech Mahindra is
firmly positive as it can move till 2000-2050 levels which is 61.8% projection
of wave i.


Comments