IDFC: Elliott Wave Counts or Banking License Assurance?
IDFC is been in news
in Dalal Street from some time especially when there was an outbreak that IDFC
has more chances to get the banking license then the other candidates. Many
analysts, brokers, investors and traders are very bullish for this stock. Does
news really drive the stock prices?
To know the answer we
used Elliott Wave analysis to get the objective answer. This advance technical analysis
is very useful tool to take proper trading decisions and helps to initiate
trade with proper risk/ reward ratio.
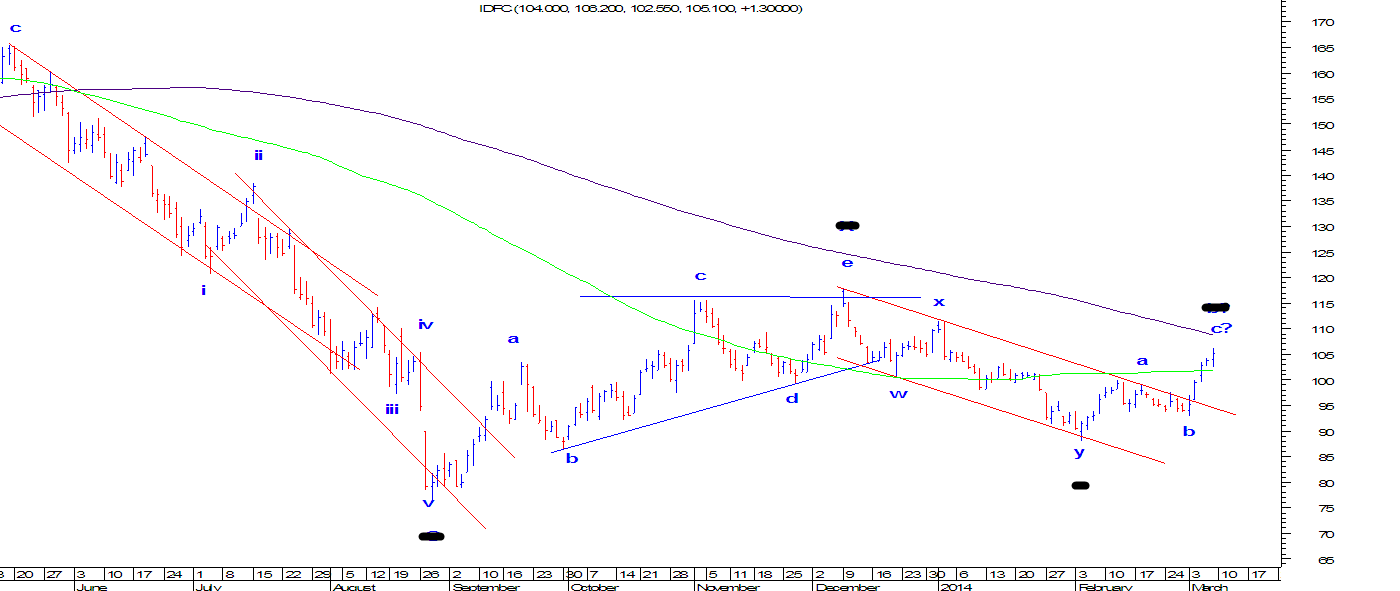
From the below daily
chart we can observe that prices has given a bullish break in the falling red
channel which has pushed prices higher till 106 after giving break on 4th
March 2014. Is this breakout going to sustain? Or it will start its down move?
We have used Elliott
Wave which says that one more leg on the downside is still pending which can
come very soon before the up move starts. The reason is after making a high of
117 in the month of December 2013 prices came down in a corrective fashion and
then it started moving up in the same manner which clearly suggests the stock
is moving in complex correction. The current up move is also a part of a
corrective wave. Using simple technical tools along with Elliott wave can also help
in finding the resistance and the support for a particular asset class. We have
used moving average concept to find out the resistance of the current corrective
move. 200 day moving average (purple) has been a resistance for this stock and
it has arrived near it. Historically from past 9 months prices have not moved
above this moving average.
In short, be
cautiously positive for IDFC as it can start moving down very soon which will
complete one higher degree wave and may start its next up move soon. For
investors and trader it is better to buy on dips


Comments