R INFRA and R CAP overview
Reliance Infra:
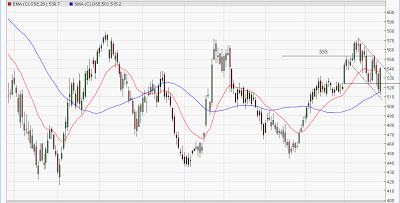
Reliance Infra bounced from 50 SMA and closed above the
previous day high gaining about 4% on Friday. The overall trend looks to be negative
as the stock is making lower high and lower low formation.
R infra has given a bearish breakout of cup and handle
pattern on Thrusday. Now it is very important for this stock to remain in a
range of 555-530. A decisive move above 555 will open up positive possibilities
and stock can move upto 570.
As per wave perspective, the stock is moving in a corrective
fashion and started 3 wave i.e simple zigzag on downside (a-b-c). Now it is
very important for this stock to remain in the downward channel for next two
days which will resume the downtrend. A
move below 520 will suggest that it has formed double zigzag (a-b-c-x-a-b-c).
In short, expect R infra to hover near the resistance of the
upper trend line of the falling channel. Move above 555 will change the trend
and move below 520 will be the sign of resumption of the trend.
Reliance Capital:
Reliance Capital is moving in sync with Infra and bounced
from 50 SMA but closed below 20 EMA. The trend is negative as it has breached
its previous low of 469 thus discontinuing the higher high higher low
formation.
Reliance Capital has given a bearish H&S breakout and
moved lower, but on Friday it gained tremendously and tested the neckline and
closed below it.
Wave counts are tricky and we shall rely on simple technical
analysis and support levels. Indicators such as, MACD and RSI continues to be
in a negative territory.
A move above 496 will change the trend and the stock can rally
to its preceding high of 510 or even higher.
In short, R cap to move lower as it failed to cross its
previous high and moved lower continuously. The target for this stock comes to
450 over short term.


Comments
Bharat Bond ETF
Bajaj Auto
Panasonic Carbon
Poddar Housing