Posts

Taiwan Weighted Index and Elliott Wave forecasting

Image
 Taiwan Weighted Index daily chart Analysis In my previous update I had mentioned for TWI, " Taiwan Weighted is near crucial resistance, any sustainable move above 17,100 will continue the uptrend and the benchmark can reach till 18,000 levels. However, reversal from current levels will drag prices till 16,300-16,100 levels." The index crossed 17100 and from there it slumped towards 16400 levels but again it closed above 17100 levels thereby opening positive possibilities for the index to reach now towards 18000 and beyond. To read my previous article on TWI, click on the below mentioned link https://www.marketanalysiswithmeghmody.com/2023/06/taiwan-weighted-anticipated-happened.html As seen in the above chart, prices are in the last leg of the 3rd wave which is wave v and can go till 17600-17700 levels from there, there can be wave 4 which will mainly remain sideways as wave 2 was steeper (alteration) and then eventually wave 5 will start which can go above 18000 levels. The
Silver Comex

Image
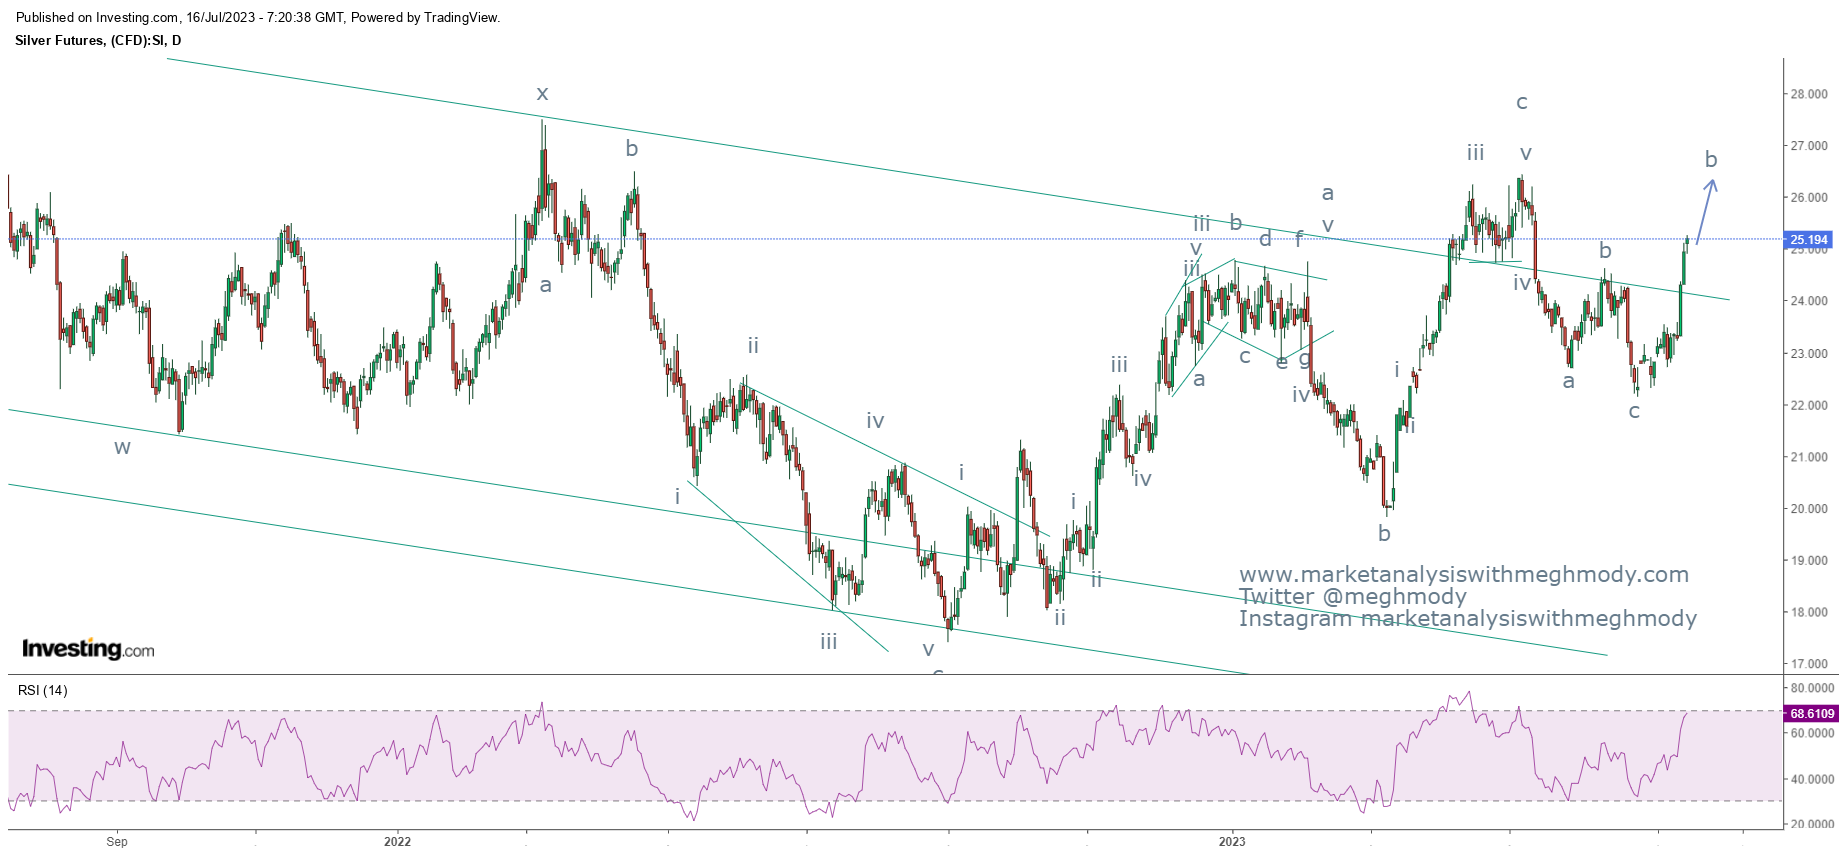
 Silver Comex daily chart Analysis Prices are moving above the falling channel and can move higher near to its previous high placed at $26.00 levels going ahead. However RSI is in overbought terrain and can relieve from here. As per wave theory, prices are moving in corrective wave or can also be an impulse if it continues to move higher well above $26.00 levels.  The summation is Silver Comex prices can surge till $26.00 levels going ahead and can even move higher once its resistance is taken out decisively. Join my Telegram Channel :  https://t.me/elliottician1 Join My Twitter handle :  https://twitter.com/meghmody? s=11&t=LtKvFYlMyQs71k-udwEPgQ

BITCOIN and Elliott Wave Forecasting

Image
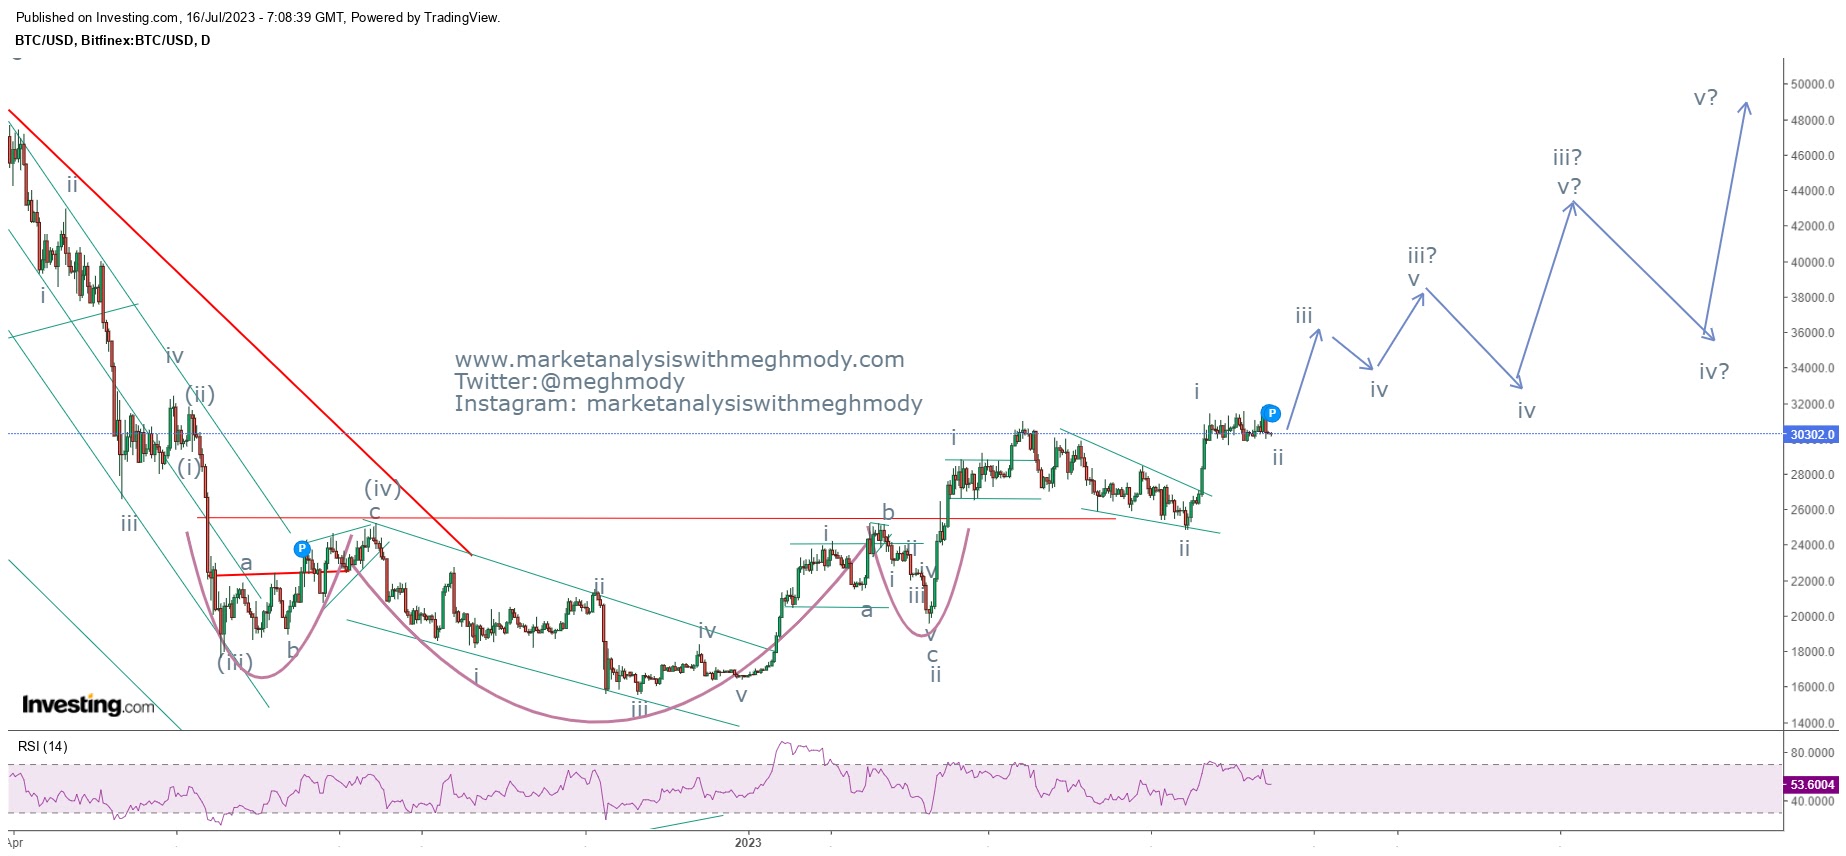
 BTC daily chart Analysis From the above chart, prices are moving in a higher highs and higher lows and it is in a stealth uptrend thereby opening positive possibilities going ahead. As per Wave theory, prices are moving in an impulse fashion where wave iii of wave iii is extended also known as extension within extension. This entire up move has the tendency to reach towards $48000-$50000 minimum. As of now prices can consolidate in the range of $31600-$29800 levels, one the above extreme breaks it is likely that the crypto can soar till $35000-$38000 price zone. The summation is Bitcoin is likely to move till $35000-$38000 zone once the level of $31600 is taken out decisively. Join my Telegram Channel :  https://t.me/elliottician1 Join My Twitter handle :  https://twitter.com/meghmody? s=11&t=LtKvFYlMyQs71k-udwEPgQ

EURINR: Impulse wave

Image
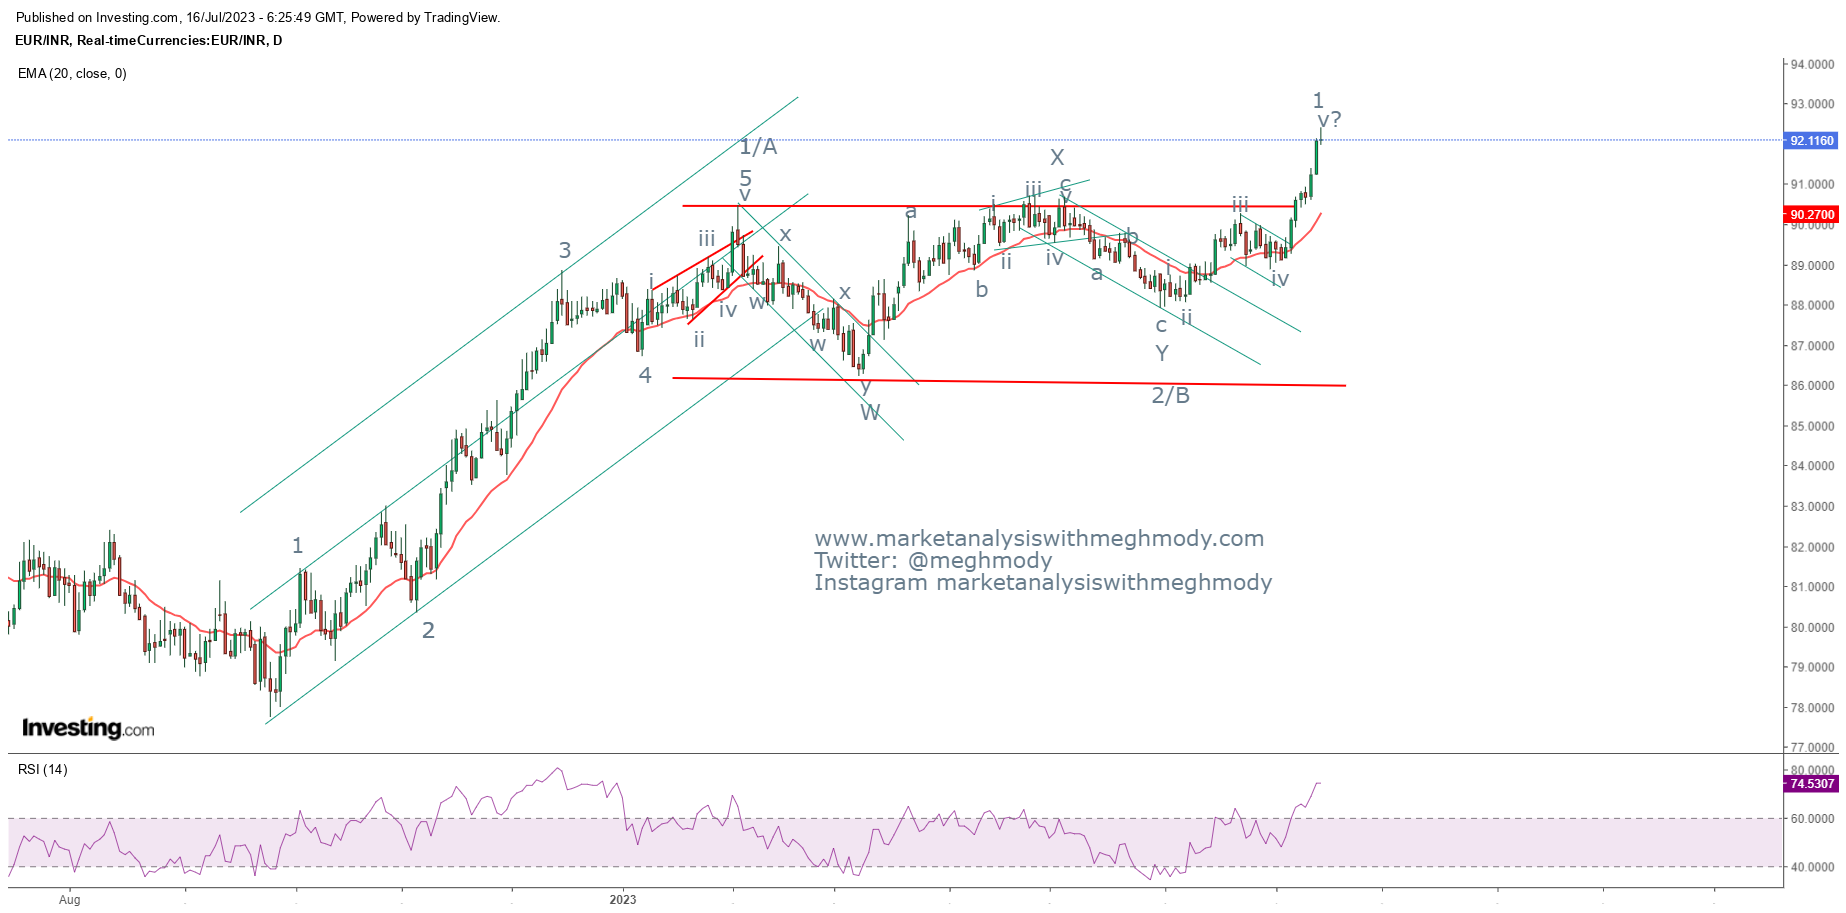
 EURINR daily chart As seen in the above chart, prices have crossed its series of tops at 91.5-91.70 levels which was acting as a crucial resistance. The pair crossed this resistance decisively and closed above it on strong footing giving an strong indication that the trend is positive and can move higher going ahead. There can be a counter correction coming into this pair which can be utilized as a buying opportunity. From Waves perspective, prices have completed wave 1/A and 2/B and has opened wave 3/C which can move higher from here. Also wave C or 3 will be impulsive in mature where wave 1 of wave C/3 is on the brink to complete that can start wave 2 lower near to 91.00 levels which can be a buying opportunity. The summation is EURINR is positively poised and can move higher once there is a dip close to 91.00 levels for the level of 94.50. Join my Telegram Channel :  https://t.me/elliottician1 Join My Twitter handle :  https://twitter.com/meghmody? s=11&t=LtKvFYlMyQs71k-udwEPgQ

Nifty Anticipated Happened

Image
 Nifty weekly chart Analysis As seen in the above chart, prices positively poised but last week it faced the resistance of 127.2% which was from highs of September 2021 till lows of June 2022. Also it is very clear that the index has formed a shooting star at the resistance of the Fibonacci which again has to be important observation. A reversal now to happen, it is important that prices need to break its previous week low of 19234 thereby opening negative possibilities.  Wave theory indicates that Nifty might have completed wave B of one higher degree at 19523 levels and can open wave C on the lower side. As of now no reversal has occurred on the charts, this can only happen once the level of 19234 is broken, which can drag prices near to 18900 levels. However, any move above 19523 will continue the uptrend. In my previous update I had mentioned that Nifty if crossed 19200 can move up towards 19350-400 levels thereby achieving my level of 19400 last week.  To read my previous article

Bank Nifty - Anticipated Happened

Image
 Bank Nifty 4 hour chart Analysis Prices are moving precisely in rising channel which is a positive sign. However, the current up move which is the impulse wave where wave 5 has come towards 38.2% from 0-3added to 4 giving an indication of a possible top. Also in the weekly chart, the index formed a gravestone doji which forms at the top giving an indication of indecision by the bulls. I think that some correction from current levels cannot be ruled out. Also the index currently holds the level of the gap which was formed during moving up. It is imperative that the index fills the gap which is placed at 44800 levels, that can open further sell off.  In my previous update I had mentioned that Bank Nifty can move higher towards 45200 once the level of 44790 is taken out and it happened what was expected.  To read my previous article click on the below mentioned link https://www.marketanalysiswithmeghmody.com/2023/07/bank-nifty.html The summation Bank Nifty can move down once 44800 is tak

FinNifty

Image
 Fin Nifty daily chart Analysis As seen in the above chart, prices have accelerated sharply in last two weeks but last week there was some kind of profit booking which could make the index stable at the highs. Also in the weekly chart, the index has formed a shooting star which is a negative sign. For a reversal to happen it is important for the index to breach its weekly low which is placed at 20053 levels. This will open negative possibilities for the index. Wave theory suggests that prices probably have completed wave b of higher degree and can start wave c on the lower side. Break of 20053 can drag prices towards 19800 levels over short term in form of wave i of wave c. The summation is Fin Nifty can reverse once the level of 20053 is broken which will infuse selling pressure dragging prices lower till 19800 levels. Join my Telegram Channel :  https://t.me/elliottician1 Join My Twitter handle :  https://twitter.com/meghmody? s=11&t=LtKvFYlMyQs71k-udwEPgQ