Posts

USDINR Bow and Tie Diametric pattern

Image
 USDINR 2 hour chart (spot) Analysis As shown above chart, USDINR pair has been moving in a stiff range of 83-82.60 levels from quite some time. Initially I thought it is moving in an ending diagonal pattern but later it turned out to be another Neo wave pattern. Last week it managed to move down below the important support of 82.50 but on Friday it moved back till 82.76 levels but closed at 82.68 levels. Once the support is broken prices will not sustain higher and as a result it is bound to break further levels on the downside. At present the closest support is at 82-81.90 levels which is the the support of the channel, From waves perspective, prices completed Neo wave bow and tie diametric pattern and has started wave c lower. It took almost more than a month to complete wave b and has opened wave c lower which can test 82-81.9. Only a break below this level will accelerate more selling which can drag prices towards 81.50-81.20 levels. The summation is USDINR is negatively firmly ne

Comex Gold Elliott Wave Aanlysis

Image
 Comex Gold daily chart Analysis From the daily chart, Comex gold is moving in a sideways pattern mainly in a range of $2100 - $1650 levels. Prices are moving in this range and have bounced recently from the support of $1650 levels, currently trading at $1860 levels. As far as the level of $1650 is intact on the downside the bias is positive and can test the upper extreme of the range which is $ 2100. As per Wave theory, prices are moving in a corrective structure and have completed wave (a-b-c) in a regular flat pattern, where it completed wave c at $1650 levels. Now it has opened a fresh leg on the upside which can go near to $2100 or even cross this hindrance. The summation is Comex Gold is positively poised and can move higher from current levels towards $2100 over short to medium term with support placed at $1700 levels.

USDJPY : Revisited and Anticipated Happened

Image
 USDJPY daily chart anticipated on 12th November 2022 USDJPY daily chart happened on 19th December 2022 In my previous update I had mentioned for USDJPY that, " USDJPY has reversed from the top and can sink near till 132-130 levels over short term." When I was writing the article and anticipating that the pair can sink towards 132-130 levels at that time it was quoting at 138 levels. It then plunged towards the support area (shaded portion) and thereby achieving my mentioned level - Anticipated Happened. To view my article on USDJPY, click on the below mentioned link https://www.marketanalysiswithmeghmody.com/2022/11/dxyeurusdgbpusdusdjpy-elliott-wave.html The pair has fallen from the highs and marked a low of 130.5 levels, the fall was impulse and prices are all set now to open a counter wave in the form of wave ii or wave b. This will again open another leg on the downside. As of now prices are likely to climb above 136-139 range over short term. The summation is USDJPY is

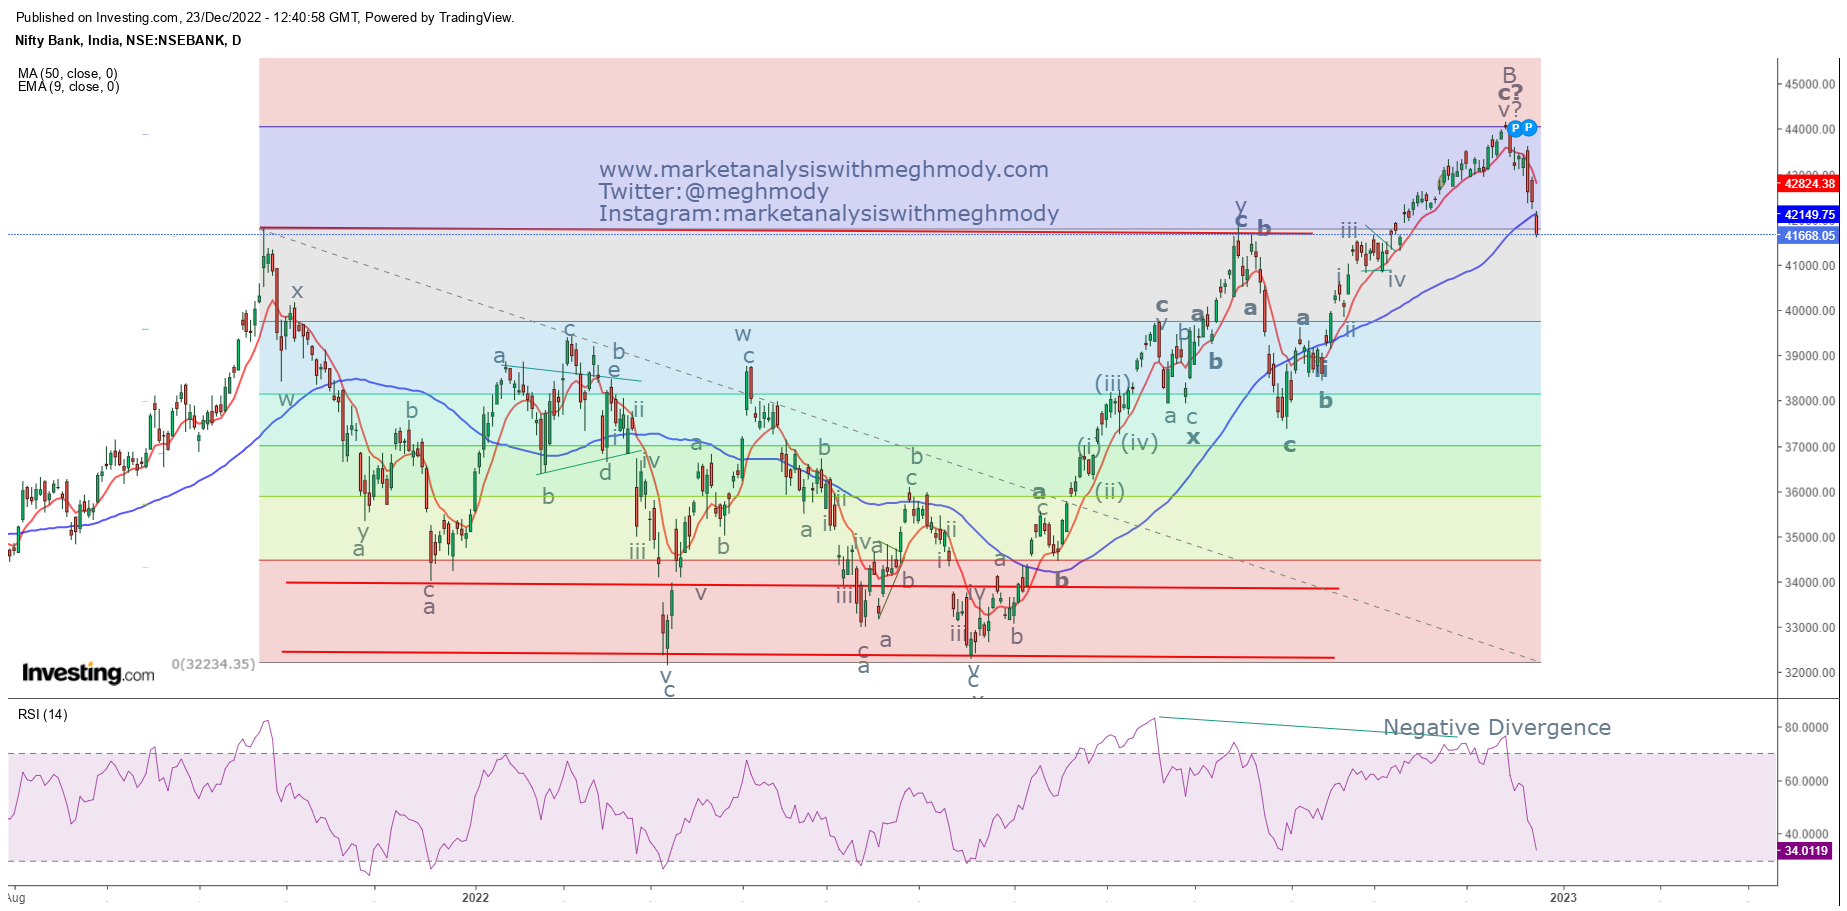
Nifty Bank Elliott Wave Analysis

Image
  Nifty Bank spot daily chart Analysis In my previous update I had mentioned that, “ Nifty Bank is likely to test 43400-43500 levels over short term and can again resume the major trend testing the levels of 42600 over medium term.” Nifty bank moved up as expected and tested the resistance of 43400-43500 levels making a high of 43610 and thereafter it plunged below the level of 42600, thus achieving my mentioned level – Anticipated Happened. As shown in the above daily chart, the benchmark has moved down below both the moving averages which is first indication of bearishness. However, RSI has arrived near to the oversold terrain and one can expect that the oscillator can relieve from the oversold terrain to make vacuum. An unfilled gap down move opens the possibility of breakaway gap. As seen in 2 hour chart, the index has arrived near multiple supports, first is the series of tops which was earlier acting as resistance now support (role reversal) (red horizontal line). Also the suppor

Ethereum Elliott Wave Counts

Image
  Ethereum 4 hour chart Analysis Just like Bitcoin, Ethereum continues to move in a stealth downtrend which is a negative sign. The crypto is moving precisely in a falling red channel in a lower highs and lower lows. As per wave theory, prices are moving in a double correction pattern (a-b-c-x-a-b-c) in which wave b on the lower side is pending, once completed wave c on the higher side will start. The summation is Ethereum can falter towards $1100-$1000 over short to medium term.

Bitcoin - Ending Diagonal

Image
  Bitcoin 4 hour chart Analysis Bitcoin continues to move in a sideways direction but the movement is tilted as if accumulation is happening at lower levels. A tilted fall is to be cautious that the selling will not intensify. This pattern in common tongue is known as falling wedge and there is still no breakout occurring. The Relative Strength Index is exhibiting positive divergence as and when the wedge was forming. According to wave theory, prices might have completed wave iv and wave v on the lower side of ending diagonal is pending which can infuse selling pressure dragging prices towards $15200-$1500 levels over short term. The summation is Bitcoin will remain in a sideways to negative terrain and the level of $15200-$1500 is pending on the downside.

Axis Bank Elliott Wave Analysis

Image
  Axis Bank hourly chart Analysis From the above chart, prices are moving in a higher highs and higher lows and it is moving precisely in rising channel. As of now no previous lows is taken out and the banking stock is currently hovering near to the support. A bounce back from here is not ruled out. MACD is in sell mode and it is below the center line which is a negative sign. RSI has approached near to the oversold terrain and has the tendency to relieve from current levels. As per Waves perspective, prices are soaring in double zigzag pattern (a-b-c-x-a-b-c). It has recently completed wave c of second correction and fresh leg on the downside has started. The recent fall looks impulse and prices can bounce from here to test 920-930 levels which can be a selling opportunity. However, failure to protect the level of 896 can infuse selling pressure which can drag prices towards 870. The summation is Axis bank can bounce near till 920-930 levels which can can be utilized as a sell