Posts

MCX Silver and Elliott Wave Counts

Image
  MCX Silver daily continuous chart Analysis In the above daily chart, prices continue to move in a higher highs and higher lows and has arrived near to a minor resistance, prices can reverse from current levels and might arrive near to 67500 levels. This fall can be utilized as a buying opportunity. ADX is clearly indicating that the positive trend is very strong and shown immense strength going ahead. As per wave theory, prices might have completed wave iii and can move down in the form of wave iv ending near to 67500-67300 levels and thereafter it can move towards 70000 in form of wave v. The summation is MCX Silver can dip towards 67500-67300 price range which can be utilized as a buying opportunity for the level of 70000 levels.

MCX Crude Oil Elliott Wave Analysis

Image
  MCX Crude Oil 4 hour continuous chart Analysis In the above daily chart, prices continue to move in a lower highs and lower lows which is a negative sign. Also the commodity is moving precisely in a falling red channel thus indicating that there can be more downside left. MACD is giving a signal of sell as the osc has cut the trigger line from above. However, advance technical open one leg higher before it falls to a new low. As per wave theory, if the current has ended (assumption), then wave c has not even retraced 61.8% of wave a to wave b, thus I think that wave c will continue to move down and has completed wave i at 5840 followed by wave ii higher which is ongoing and can test 6500-6600 range. The summation is MCX Crude Oil is all set to move towards 6500-6600 price range before major fall starts.

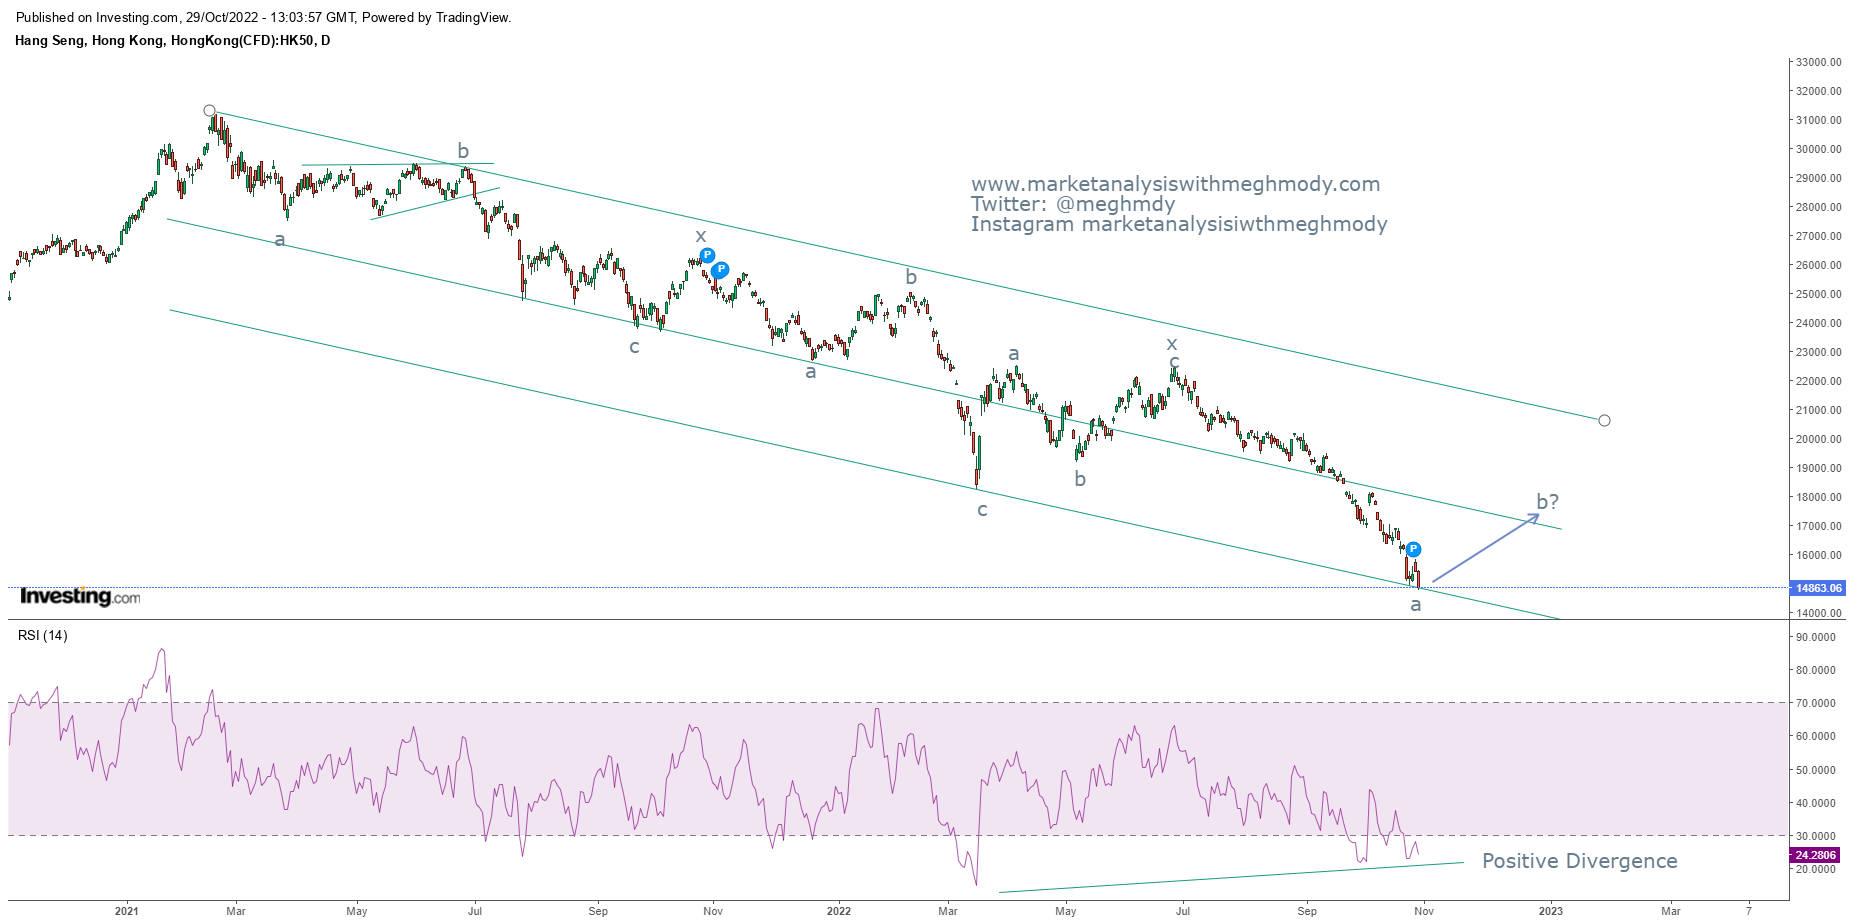
Hang Seng Anticipated Happened

Image
  Hang Seng daily chart Anticipated on 29 th  October 2022 Hang Seng daily chart happened on 11 th November 2022 Analysis In my previous update on Hang Seng dated on 30 th October 2022, I had mentioned that, “ Hang Seng can start a counter trend which can surge prices near till 16800-17000 levels over medium term .” The index climbed above 17000 thereby achieving my mentioned level of 16800-17000– Anticipated Happened. To view my previous article on Hang Seng, please click on the below mentioned link https://www.marketanalysiswithmeghmody.com/2022/10/hang-seng-elliott-wave-analysis.html As seen in the above chart, prices rallied from the support of the channel and has approached towards its resistance. There can be limited upside still left but it will be short lived. For a reversal to happen, it is important that prices break the level of 18800 which can drag prices towards 14200 levels. RSI has arrived near to the overbought terrain, as far as the lower highs and lower lows a

USDINR and Ending Diagonal

Image
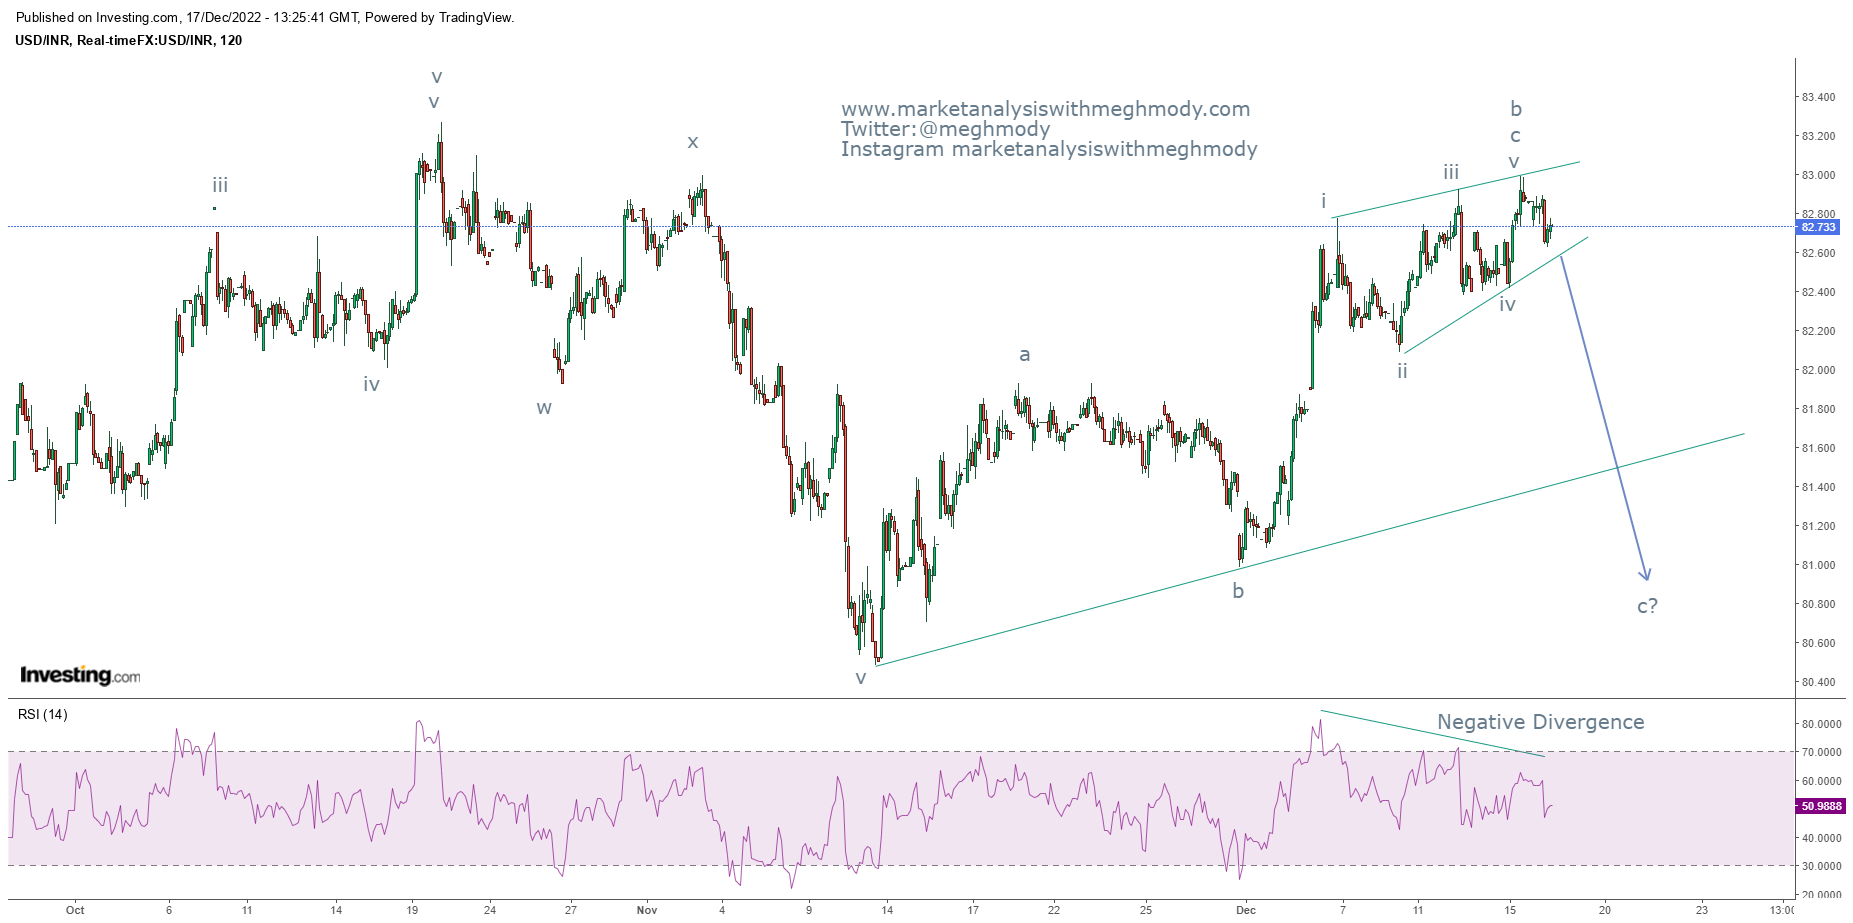
  USDINR spot hourly chart Analysis As shown above chart, USDINR continues to move in a sideways direction with a slight tilt in price action. This tilt in common technical terms is formed into a pattern known as rising wedge. The rising wedge has accompanied with negative divergence in RSI indicating that the upside is halted. My view in continues to remain negative but the targets will be revised. Rising wedges often gives a negative breakout, it is likely that the pair will move down once the level of 82.5 is broken which will infuse selling pressure dragging prices towards 81.8 ort term. It is imperative that pair breaks 81.6 which can accelerate more selling in this pair. As per wave theory, prices have now completed wave b in which wave c has formed an ending diagonal pattern. A break below 82.50 will confirm that wave c of one higher degree of flat pattern has started. The summation is USDINR is all set to plunge and test 81.8 over short term followed by 80.6, only if 81

Nifty Anticipated Happened and Elliott Wave Analysis

Image
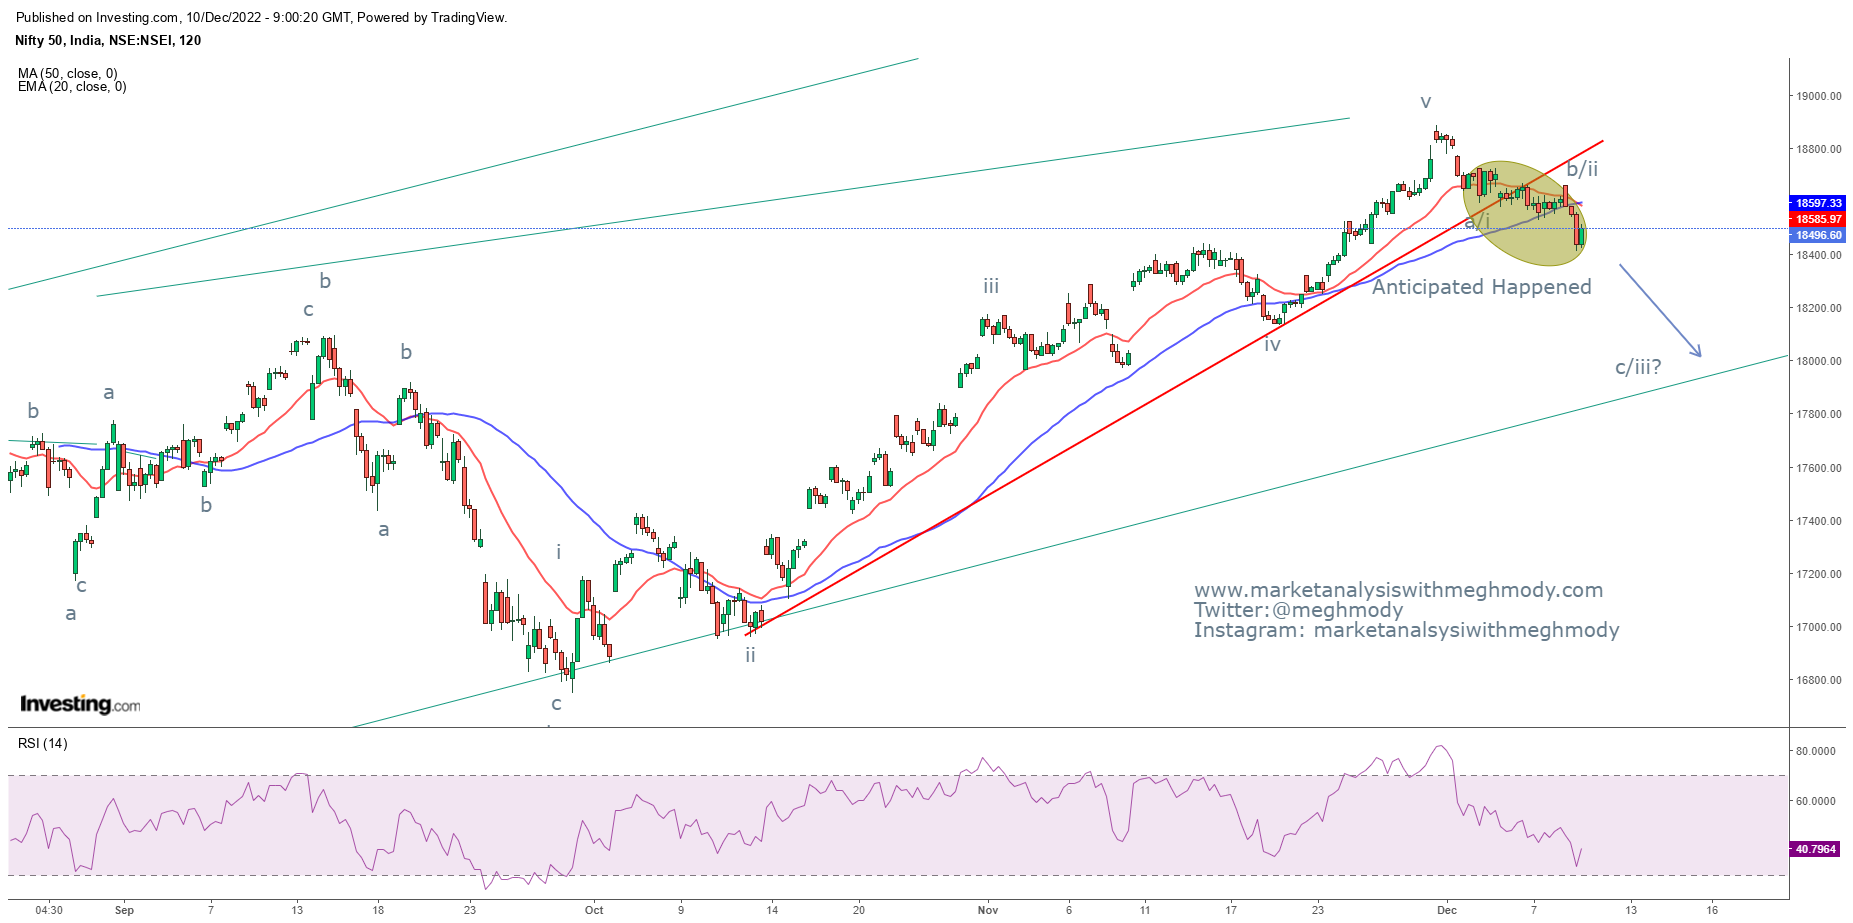
 Nifty 2 hour chart  Analysis In my previous update dated 5 th Dec I had mentioned, “ Nifty possibly can reverse from current levels and test the support of 18450-18400 levels over short term. The resistance will be placed at 18900 (closing basis).” The index made a low of 18410 which was marked on the last day of the week, thereby achieving my level – Anticipated Happened To read my previous article on Nifty, click on the below link https://www.marketanalysiswithmeghmody.com/2022/12/nifty-and-elliott-wave-analysis.html From daily chart, the index continues to be above both the moving averages and it indicates that the trend is still positive. Any move above 18600 will open further positive possibilities and can push prices above the previous high. However, a move below 18400 can drag prices near to 18200 followed by 18050 levels. MACD continues to give a sell signal with negative divergence. In 2 hour chart, Nifty has broken the trend line support (red) and it is below both t

MCX Copper : Elliott Wave 5 on the move

Image
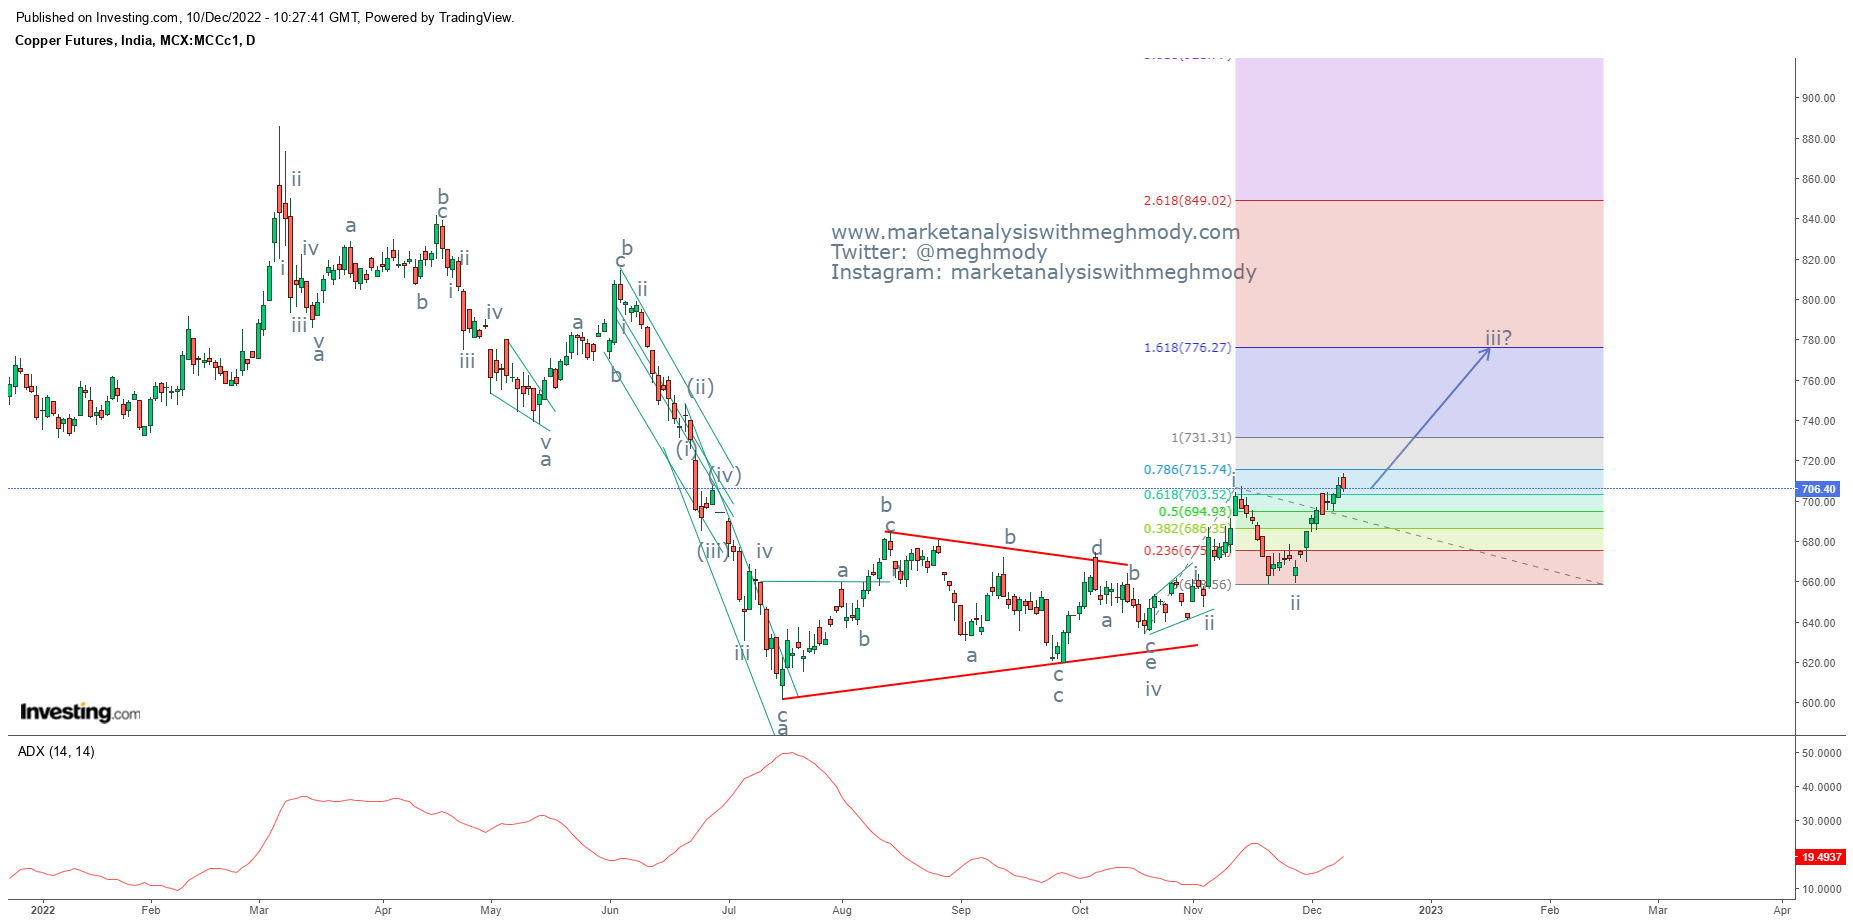
 MCX Copper daily continuous chart Analysis In the above daily chart, prices continue to move in a higher highs and higher lows after coming out from the consolidation zone. There is a high possibility for prices to move higher from current levels which can attempt to reach its preceding high. ADX has started moving higher. However, the strength is still not seen but once it moves above 20 then the trend will show immense strength. As per wave theory, prices completed wave iv of higher degree in a symmetrical triangle pattern. It has now opened wave v of wave iii which can go till 770-776 levels. The summation is MCX Copper is set to move in a positive direction and can test the level of 770-776 over short term.

US 10 year yield - Anticipated Happened

Image
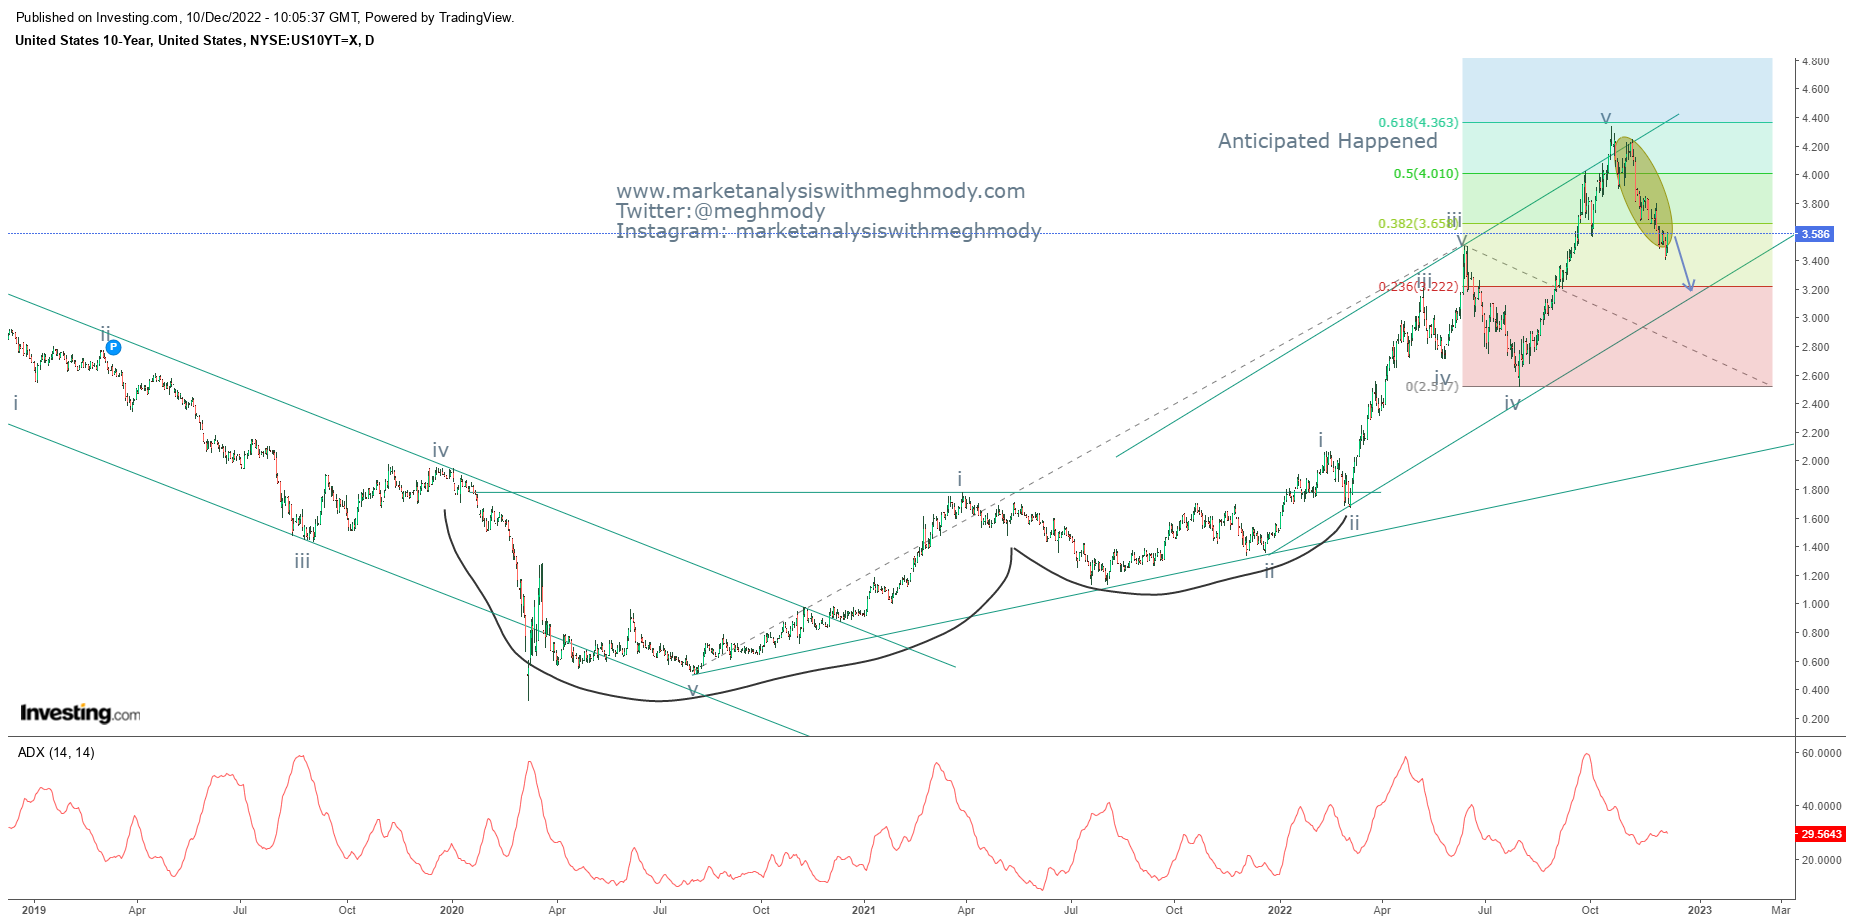
 US 10 year yield daily chart Analysis In my previous update on US 10 Year yield updated on 27 th November 2022, I had mentioned that, “ US 10 Year Yield is negatively poised and can move down towards its support placed at 3.55% over very short term.” The yield plunged below 3.55 thereby achieving my mentioned level– Anticipated Happened. T o see my previous article on 10 year yield , click on the below link https://www.marketanalysiswithmeghmody.com/2022/11/us-10-year-yields-and-elliott-wave.html As seen in the above chart, the yield has started moving in the opposite direction and continues to persist in the rising channel. It is imperative to see if it plunges near till the support of the channel which is placed near to 3.20% ADX is showing strength as it is above 25 thereby indicating that the trend is showing strength. From Waves perspective, the current fall is a part of wave a and can move down further till 3.20% The summation is US 10 year yield is negatively poise