Posts

MCX Zinc Anticipated Happened and Elliott Wave Analysis

Image
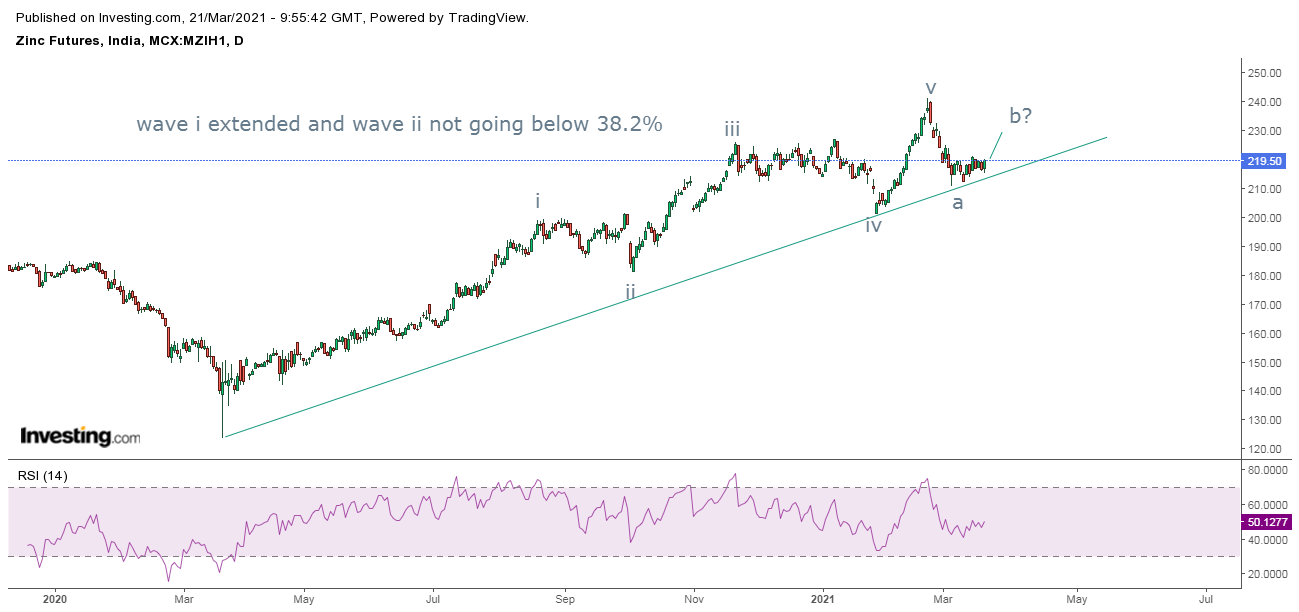
 MCX Zinc hourly continuous chart anticipated on 21st March 2021 MCX Zinc hourly continuous chart anticipate happened on 8th April 2021 In my previous update on MCX Zinc dated 21st March 2021, I had mentioned, " MCX Zinc is positively poised and can move till 230-232 levels over short term with support placed at 214 on closing basis." Zinc failed to move below 214 levels and continues to soar there by achieving the level of 230-232, thus gaining 5% in fortnight. Here is the link of my previous article on Zinc, click on it https://www.marketanalysiswithmeghmody.com/2021/03/mcx-zinc-elliott-wave-analysis.html At present, prices are moving in wave c which is impulse in nature in which it is moving in wave iii. It has also reached 78.6% of the previous fall. After that wave iv and wave v up is still pending. Elliott Wave is difficult but with practice it will make you professional from a novice trader/analyst. Learn from me how to make practical application on different charts. T

MCX Copper Anticipated Happened

Image
 MCX Copper hourly continuous contract anticipated on 21st Mar 2021 MCX Copper hourly continuous contract happened on 5th April 2021 In my previous update about MCX Copper, I had mentioned that, The red metal can move up till 690 levels in the form of wave a of wave b. it achieved the mentioned level on 5th April- Anticipated Happened. Here is the link of my previous article about MCX Copper, click to read it https://www.marketanalysiswithmeghmody.com/2021/03/mcx-copper-anticipated-happened-and.html After completing the first correction (a-b-c) which I have marked wave a at one higher degree, the other possibility I am opening is wave x on higher side.  In the second scenario, I am opening wave b up in which wave a has still some room. one it is down wave b of wave b will come down followed by wave c of wave b which can go till 80-100% of wave a of one higher degree. I will monitor the movement in this counter and will updates about it as it moves down to form wave b. If it retraces mo

Nifty Bank Elliott Wave Analysis

Image
 Nifty Bank daily chart Nifty Bank hourly chart From the above daily chart, the index which was moving in a rising channel has given a bearish break by trading below the support. However, there are high chances that prices might test the resistance which was earlier acting as a support (role reversal). At present, prices are moving down in a small falling channel and it is making an attempt to bounce from its support. RSI is also turning from down to up but it is below the center line. In hourly chart, prices are moving in a falling channel by forming lower highs and lower lows, indicating that the trend (short term) is negative. Currently prices are at crucial juncture as it might bounce from the support of the falling channel and can move back up towards its resistance. It has also completed inverse head and shoulder pattern which is bullish reversal pattern. From Waves perspective, the Nifty Bank is moving either in double correction (a-b-c-x-a-b-c) or only a correction (a-b-c).

Nifty Elliott Wave analysis

Image
Nifty daily chart  Nifty hourly hart From the above daily chart, the index is moving in a sideways to negative direction and has started making lower highs and lower lows. This is an indication that the short term trend has now turned negative. The index has a crucial support at 14100-14000 levels where the rising trend line is placed. It is likely that there will be resilience from current levels which can push the index near to its previous high. Daily RSI has still not broken its previous low. In hourly chart, prices are moving in a falling channel, it has found support near to the lower trend line of the channel and has bounced from there several times. On last Friday, the index opened with a gap up and continues to soar. RSI has a support at 30 and it shows that it is now moving higher. From Waves perspective, the Nifty is moving in double correction where after completing (a-b-c) in flat pattern, it is now forming wave x which is also a flat pattern and in which wave c is pen

MCX Copper Anticipated Happened and Elliott Wave Analysis

Image
 MCX Copper hourly continuous chart anticipated on 13th Mar 2021 MCX Copper hourly continuous chart happened on 19th Mar 2021 In my previous update dated 13th Mar 2021, I had mentioned for MCX Copper, " MCX Copper can move down till 660 levels once the level of 674 is broken accelerating selling pressure. Failure to protect the level of 687 will open positive possibilities." Prices slumped till 660 levels marking a low of 659 on the last trading day of the week once the level of 674 was broken. Anticipated Happened To read the previous article on MCX Copper here is the link https://www.marketanalysiswithmeghmody.com/2021/03/mcx-copper-elliott-wave-analysis.html Now since it has completed wave a-b-c pattern it is now clear that the red metal will travel north o form another pattern. This means the first correction fallen from the highs was wave a at one higher degree, so now wave b will start or  might have started which can soar prices. So wave a of wave b can move up  till 6

Nifty Anticipated Happened and Elliott Wave Analysis

Image
 Nifty hourly chart anticipated on 13th March 2021 Nifty hourly chart happened on 19th March 2021 On my previous update mentioned on 13th March 2021, I had mentioned for Nifty, " Nifty is all poised to move down once the level of 14900 is broken which can drag prices till 14400-14300 price zone." Nifty after breaking 14900 stumbled till 14350 levels which was marked on 19th March and was also the mentioned level falling in the price zone of 14400-14350 levels. Anticipated Happened For reading the previous article on Nifty, click on the link https://www.marketanalysiswithmeghmody.com/2021/03/nifty-elliott-wave-analysis.html Nifty is now moving in a falling channel and it has shown signs of reversal from the support of the channel and also the falling trend line which was acting as a cruical resistance is broken which opens positive possibilities. This states that the index can move higher from current levels near till 15100-15200 levels where the resistance of the channel is p

MCX Zinc Elliott Wave Analysis

Image
 MCX Zinc daily continuous chart MCX Zinc hourly contiuous  As shown in the daily chart, MCX Zinc is moving precisely above the rising trend line and also forming higher highs and higher lows which is a positive sign. At present the metal is trading near the support of the trend line and can bounce from current levels to test its previous high. RSI is hovering between the center line. From hourly chart, prices have not discontinued the positive pattern and so there are high chances for the metal to move higher from current support area. However, RSI is in overbought terrain which will make the counter move sideways to negative in the early week but can reach till or near to its previous high As per Wave theory, after completing wave v higher, prices moved down in complex correction (a-b-c-x-a-b-c) and completed wave a. Currently it is moving in wave b in which it has completed wave a and wave b, this opens wave c higher which can travel till 7836-80% of the recent fall which comes to 2