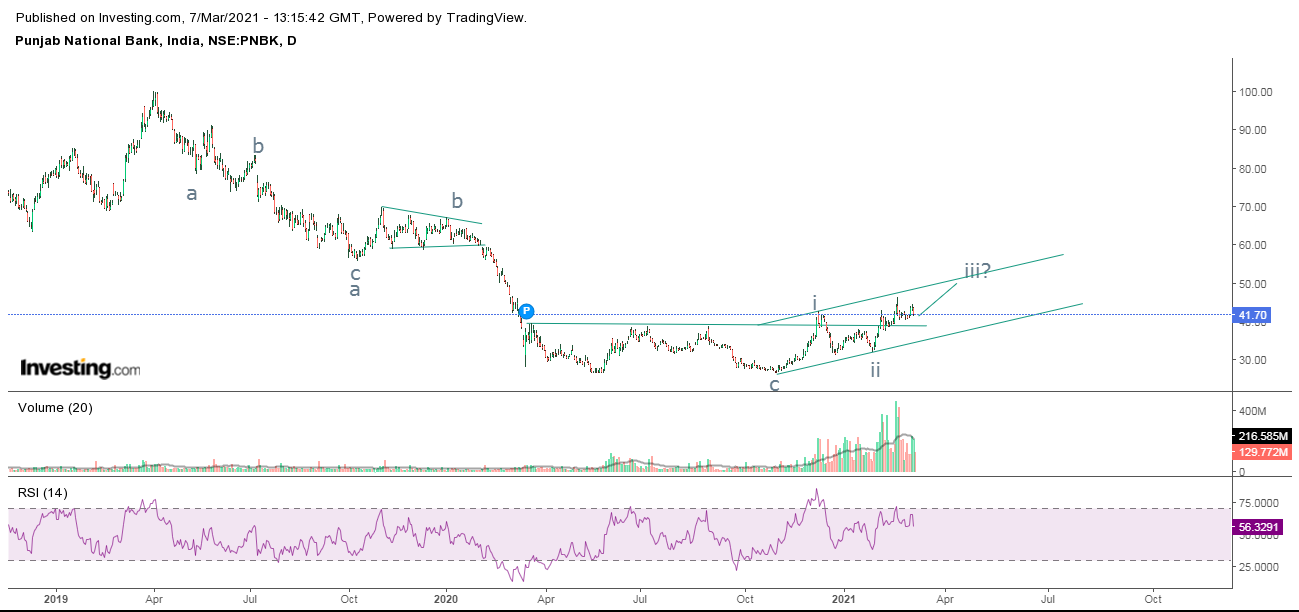
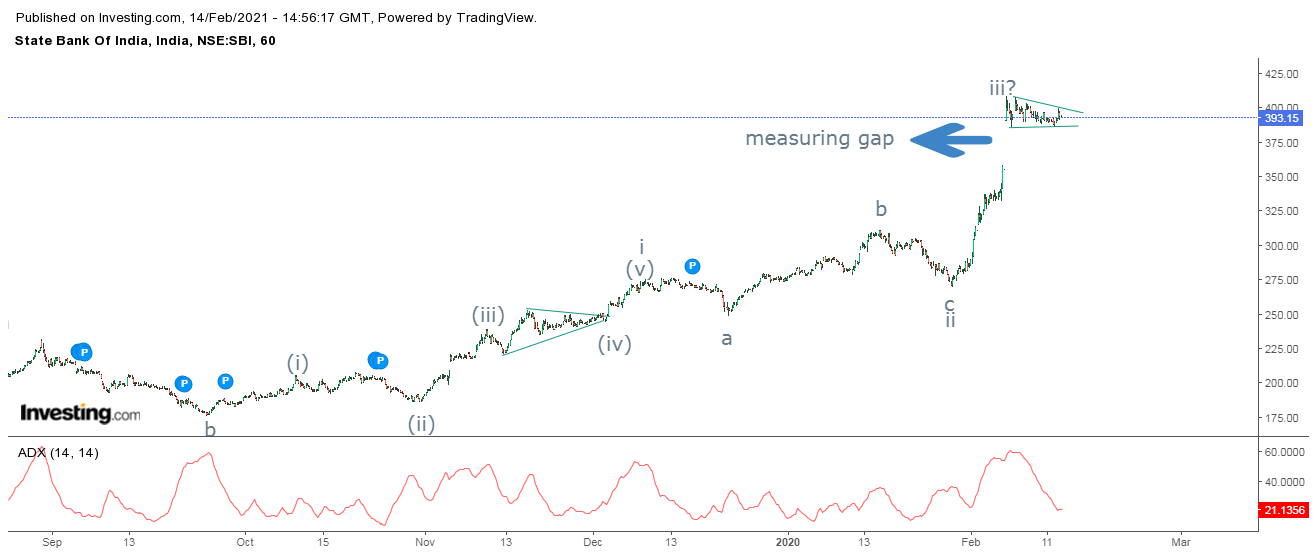
MCX Crude Oil Wave equality and analysis

MCX Crude Oil daily chart As shown in the daily chart, MCX Crude Oil is moving in a higher highs and higher lows after moving below 0 levels. It can also be seen that, prices have moved above cluster of resistances (marked by black horizontal line). However, it is RSI which has moved in overbought terrain. Now the level of 4700 will act crucial as it will provide good support to this counter. There are high chances it will move down to test it. Any sustainable move above 4700 will take prices higher to 5000-5100 price zone over short term. Failure to protect the level of 4700 for couple of days will see some correction. From Waves perspective, the MCX Crude Oil is moving in impulse fashion. Where it has completed wave I and wave ii and it has either completed wave iii or it is still ongoing. As wave i and wave iii are equal in terms of price. The summation is MCX Crude Oil has an important support near 4700, sustainable move above this level will surge it to 5000-5100 price zone