Nifty Elliott Wave Analysis
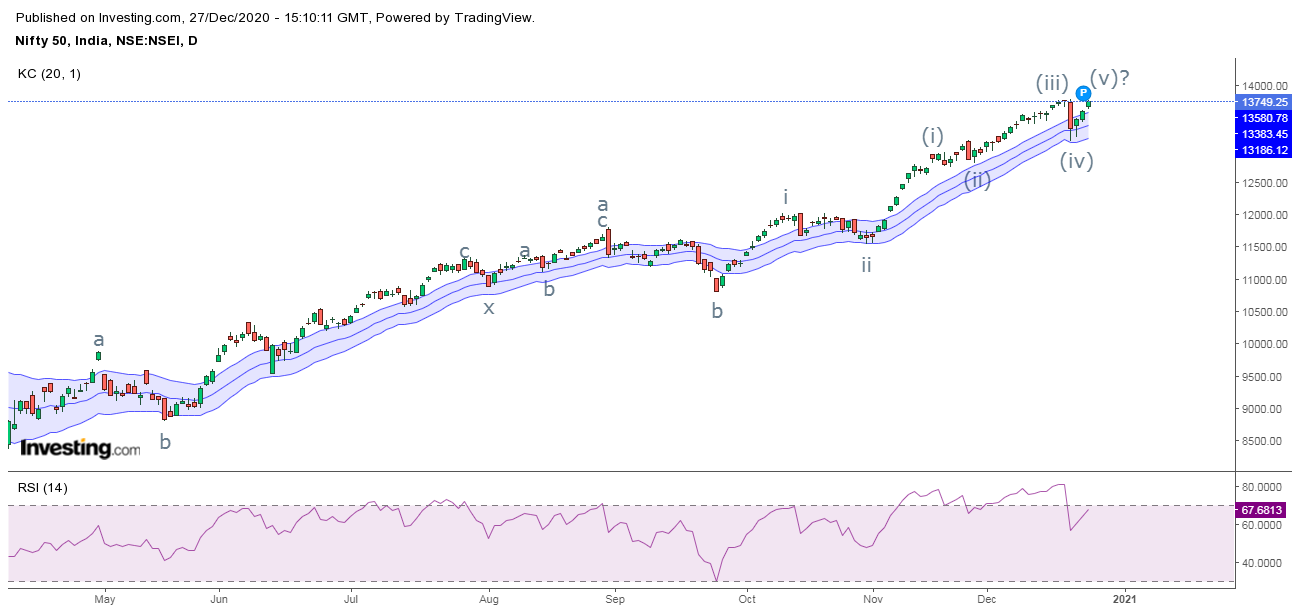
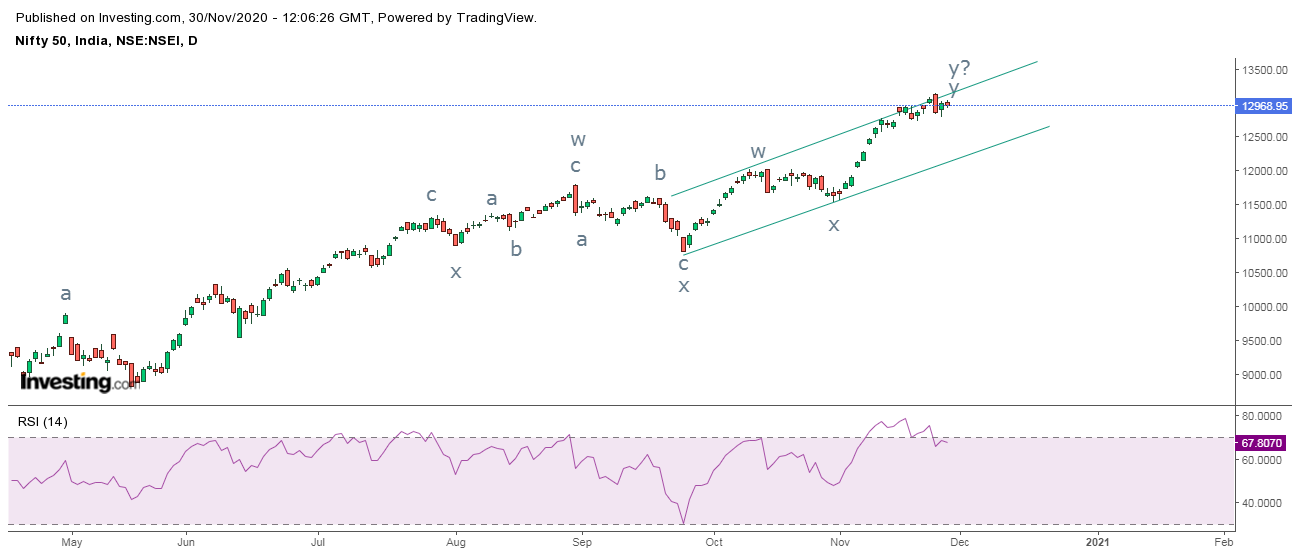
Nifty daily chart Nifty hourly chart In the above daily chart, the index has moved in a positive direction by forming a higher highs and higher lows. Also by applying Keltner channels, it is very clear that prices has given close above the upper Keltner band on Thursday and closed above its previous high on the last day of week which gives a positive break in price action. RSI has relieved from the overbought zone and it is all set to move back in. In the hourly chart, prices are moving in a rising channel formation where recently it bounced from the lower end of the channel and can move higher to test the resistance. It is imperative for prices to cross13780 levels where there is small hindrance, thus infusing further buying. RSI has still room to go in the overbought zone. From Waves perspective, prices are moving in wave c where wave iii is extended in which wave v is ongoing and can till 14000 levels which is 61.8% from wave (iii) to wave (iv). The summation is Nifty needs t