Posts

TATA Motors Elliott Wave Analysis

Image
 Tata Motors Daily chart Tata Motors hourly chart From the above daily chart, Tata Motors continue to move in a higher highs and higher lows. Recently, this stock has also given a bullish break in cup and handle pattern. The resistance was around 120 levels which was crossed and made a high of 132.6 levels. The sell off on Friday dragged the gains and it closed at 124 levels. As per hourly chart, prices are supposed to find strong support at 120-122 levels (shown by horizontal shaded lines). After that uptrend will continue and prices are set to even cross its high of 132.6 in near term. RSI has also relieved from the over bough zone and is set to reverse soon. From wave perspective, after the triangle pattern, prices are moving in wave c which is impulse in nature. In wave c prices have completed wave i, wave ii and wave iii in an extended form. At present wave iv is ongoing which can be terminated at 120-122 levels and after that wave v higher will start. The summation is Tata

Nifty Anticipated Happened and Elliott Wave Forecast

Image
 Nifty hourly chart anticipated 9th August 2020 Nifty hourly chart happened on 11th August 2020 In my previous update dated 10 th August 2020, I had mentioned for the benchmark, “ The summation is prices are set to soar till 11342 levels with a support of 11120, a sustainable move above it will open further positive possibilities.”- Anticipated Happened. Here is the link click on it https://www.marketanalysiswithmeghmody.com/2020/08/nifty-elliott-wave-analysis.html On 11 th August, prices surpassed its previous high of 11342 and made a new high of 11377, thereby achieving my target. I had also mentioned that, if it sustains above 11342 then it will continue to be in uptrend. However, on the last trading week there was a considerable correction which dragged the index till 11116 and closed at 11178 levels. As shown in hourly chart, the benchmark is at crucial support of the rising trend line, on Friday it broke the support but closed well above it, thereby respecting it. RSI on ho

USDINR Elliott Wave Analysis

Image
USDINR daily chart USDINR hourly chart From daily chart, the currency pair is moving down in a falling channel which is a negative sign, also it is arriving near the support of the big rising channel which is placed at 74 or even lower. RSI is also whipsawing the center line which gives no clear signals. As per hourly chart, prices are moving in a lower highs and lower lows and it has found resistance near to its previous high and is showing signs of reversal. RSI is all poised to fall from current levels and can drag price till lower end of the falling channel. Wave theory suggests, USDINR is moving in a complex correction pattern, in which second wave x and now it is all set to move lower in form of wave z which also has to be corrective in nature. The summation is prices are set to plunge in order to test the support of the falling small channel which comes to 73.8-74 levels and the resistance will be at 75.8 (closing basis). Education Learn Technical Analysis in our 4 month

Nifty Elliott Wave Analysis

Image
Nifty hourly chart As shown in hourly chart, Nifty continues to move in a higher highs and higher lows formation and it is trading above the rising trend line which is a positive sign. In last one week it has bounced from the trend line support and it is consolidating, this indicates a possibility for prices to run north, once the consolidation is complete. Hourly RSI has also relieved from the overbought region and is now set to move higher. As per Wave theory, prices have completed wave c at 100% from wave a to wave b, the correction then onwards can be plotted as either wave x or wave a of wave x. The fall from 11342 to 10884 is a three wave structure and so if the up move is wave b of wave x then it can travel till 80-100% of wave a of wave x.   The index has already retraced 78.6% of wave a of wave x and so I believe it can go till 100% of wave a which is at 11342 levels. If it sustains above it then the first correction where I have marked wave x/a will be wave x and second cor

RBL Bank Elliott Wave Analysis

Image
RBL Daily chart On the first Friday of August 2020, RBL bank gave a bullish break in a falling channel which opens positive possibilities and also resumption of major trend to follow, which in this case is up. It was up by 10% on the day of breakout and this uptrend will continue to go on. As per Elliott wave analysis, prices have completed wave iv at 160 levels and has started moving in a positive note in the form of wave v which can test 61.8% from wave i-ii-iii to wave iv. In short expect prices to soar for couple of weeks till 225 levels where cluster of resistances are placed, the support will be at 170. Education Learn Technical Analysis in our 4 month course to help you to identify better trade setups. This course will be conducted every once in a week for around 4 hours. This theory can be applied on all free floating markets. In this course learn from basic to advance and the fees for the same will be Rs. 12,000/- Elliott and Neo Wave analysis is conducted for 1 month, this is

DLF: Anticipated Happened and Elliott Wave Analysis

Image
DLF hourly chart In my previous dated 11th July 2020 on DLF , I had mentioned that, prices will falter once the level of 145 is broken which can drag prices till 136, prices made a low of 135 and from there it has shown signs of reversal. The yellow shaded part is the fall which was anticipated. Here is the link of the above article, click here on the link https://www.marketanalysiswithmeghmody.com/2020/07/dlf-elliott-wave-analysis.html As of now I think prices have completed wave b of first leg of wave b in form of wave a. This means I am expecting wave b higher which can move up from current levels. Now the first leg of wave b which is wave a is a three wave structure, so wave b of wave b has to be a three wave up move in which wave a and wave b is over and wave c has started which can rally till 80% of of the fall. The summation is, DLF can rally near till 163 levels which is a minimum target, it can rally further but that can be monitored later. Education Learn Technical Analysis i

Nifty Bank Elliott Wave Analysis

Image
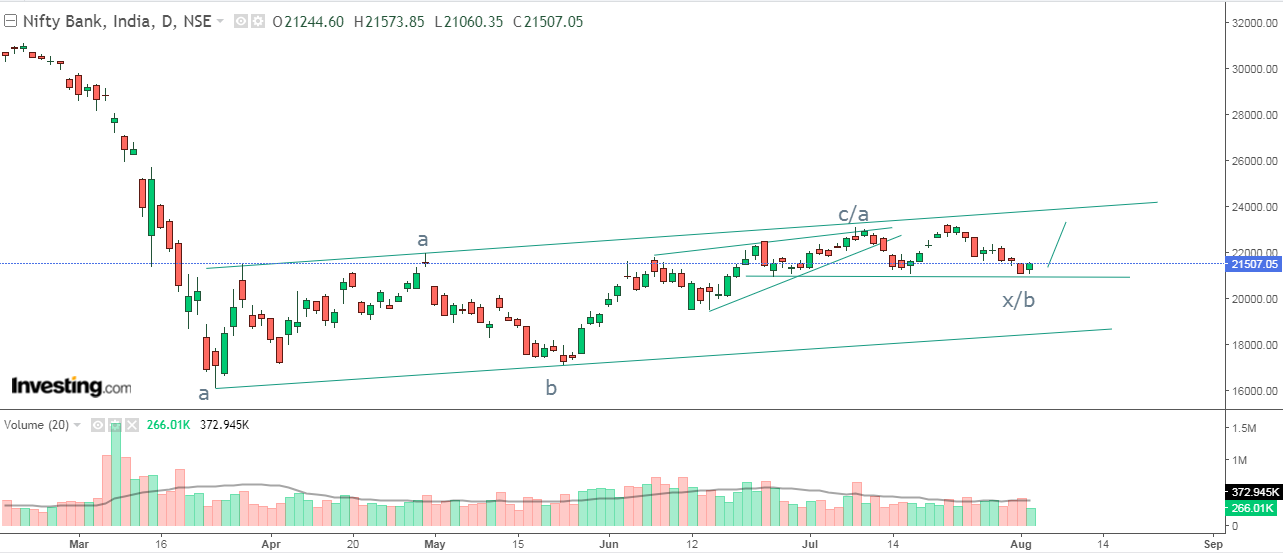
Nifty Bank Daily chart In the above daily chart, prices are moving in a higher highs and higher lows formation, recently in the right hand side of the chart, the index have arrived near cluster of supports drawn by horizontal line, this support has made prices bounce near to the resistance of rising channel. From Wave perspective, the index has strong support at 21000 where wave x/b is possibly over and has shown signs of resilience which can open either wave c higher or wave a of second correction, in both the scenarios the index is poised to go in positive direction.  The summation is Nifty Bank can reach till 23300 levels which will be immediate resistance with support at 21000 (closing basis). Education Learn Technical Analysis in our 4 month course to help you to identify better trade setups. This course will be conducted every twice in a week for around 2 hours. This theory can be applied on all free floating markets. In this course learn from basic to advance and the fees for th