Posts

Axis Bank ElliottWave forecast

Image
As per hourly chart, the banking stock has given fresh bullish break in a falling channel which is a positive sign. As of now it is above the falling trend line which is now acting as a support, earlier it was a resistance (polarity reversal). RSI is now moving higher from current levels. From wave perspective, prices are moving in wave c which is impulse in nature after completing wave a and wave b. In wave c it has completed wave i and wave ii and now it will start wave iii higher. The summation is Axis Bank is all set to soar till 480 levels with support placed at 375 levels. Elliott and Neo Wave analysis is conducted for 1 month, this is an advance technical course suited for professional traders. Twice a week, 2 hours will be given for theory as well as practical application. The fees for it will be Rs. 10,500/-. Classroom training and webinars both are available. If you reside in Mumbai, classroom training is conducted in Vile Parle near station and Borivali Station. For inquiry
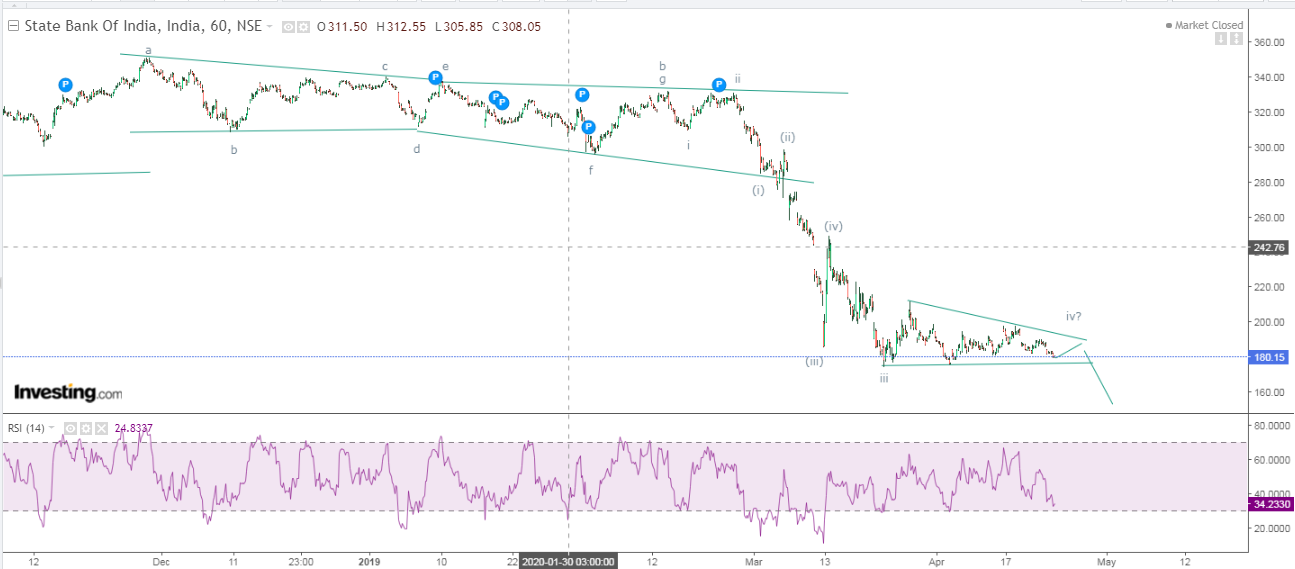
SBI: Anticipated Happened and Elliott Wave forecast

Image
SBI hourly chart anticipated on 25th April 2020 SBI hourly chart happened In my previous update I had mentioned that," SBI will move down till 165 if the level of 175 is broken." I had also mentioned that triangle is in making which is exactly what has happened. Now it seems that prices are all set to surge as wave c is completed with five sub-waves in it after triangle pattern. Now fresh leg has started which will soar price till 175-180 levels over short term. Elliott and Neo Wave analysis is conducted for 1 month, this is an advance technical course suited for professional traders. Twice a week, 2 hours will be given for theory as well as practical application. The fees for it will be Rs. 10,500/-. Classroom training and webinars both are available. If you reside in Mumbai, classroom training is conducted in Vile Parle near station and Borivali Station. For inquiry and registration call +919324174580.

MCX Silver anticipated happened and Elliott Wave forecast

Image
MCX Silver hourly continuous chart anticipated on 31st March 2020 MCX Silver hourly continuous chart happened on 20th May 2020 In my previous update dated 31 st March 2020, I had mentioned that, “Silver is poised to move higher near till 49200-49300 levels with the support at 38900 levels. The bias is firmly positive for Silver over short to medium term.” On 20 th May it made a high of 49500, thus achieving my mentioned level of 49200-49300 when it was trading at 41000, gaining stupendous 20%- Anticipated Happened. Here is the link of my previous article on MCX Silver-  https://www.marketanalysiswithmeghmody.com/2020/03/mcx-silver-elliott-wave-forecast.html As per hourly chart, prices are expected to remain in a range of 46850-49400 after that there are high possibility to cross 49500 impressively which can soar prices till 50600 levels over short term. RSI has bounced from the oversold territory. From Wave theory, Silver is moving in wave iv of the impulse rally, It is likely to m

ACC: Elliott Wave forecast

Image
ACC hourly chart As per hourly chart, prices are moving in a sideways direction, it is important for this stock to move above 1250 levels which will open further positive possibilities soaring it till 1500 levels. However, RSI is in overbought terrain and there are high chances for it to relieve from it first. From wave perspective, prices have completed wave b/ii which can be seen in the hourly chart at 1125 levels and it is now moving in wave c/iii higher, price confirmation can be obtained above 1250 which can resume the major trend. The summation is only a move above 1250 will open further positive possibilities which can surge prices near till 1500 levels with support at 1150. Elliott and Neo Wave analysis is conducted for 1 month, this is an advance technical course suited for professional traders. Twice a week, 2 hours will be given for theory as well as practical application. The fees for it will be Rs. 10,500/-. Classroom training and webinars both are available. If you

Motherson Sumi Elliott Wave forecast and symmetrical triangle pattern

Image
Motherson Sumi hourly chart Motherson Sumi has shown resilience from 50 levels and is now trading at 79. The first structure after making the low of 50 was an impulse which has five wave marked in a numerical manner, after that prices are trading in a contracting pattern which has eventually formed in a symmetrical triangle pattern. Now it is imperative for prices to cross 85 levels to give bullish break which can surge the price near till 100-105 levels which is 61.8% of wave a to wave b . The symmetrical triangle pattern has not retraced till 61.8% and it is on the bring to terminate near till 38.2% of wave a of one higher degree. This means wave c higher is pending and this entire structure wll convert into zigzag pattern. Elliott and Neo Wave analysis is conducted for 1 month, this is an advance technical course suited for professional traders. Twice a week, 2 hours will be given for theory as well as practical application. The fees for it will be Rs. 10,500/-. Classroom training a

Axis Bank Anticipate happened and Elliott Wave Forecast

Image
Axis Bank hourly chart In my previous update dated 16th May 2020, I had mentioned that, "   Prices are poised to falter till 360-355 levels where the support of the channel is placed with resistance at 410." Prices made a low of 335 which achieved my above mentioned level. - Anticipated Happened Here is the link of the previous article on Axis Bank-  https://www.marketanalysiswithmeghmody.com/2020/05/axis-bank-elliott-wave-forecast.html Now as prices has arrived near support of the falling shaded channel there are high chances for this banking stock to soar from current levels which can test 380-385 levels. As per Elliott Wave, prices might have completed wave a of the second correction post wave x, this means wave b higher cannot be ruled out. Elliott and Neo Wave analysis is conducted for 1 month, this is an advance technical course suited for professional traders. Twice a week, 2 hours will be given for theory as well as practical application. The fees for it will be Rs. 1

Nifty Elliott Wave Analysis

Image
Nifty hourly chart In my previous week update I had mentioned that, “ there can be a push in prices which can soar it near about till 9400-9500 price range, which can be a bull trap. Any reversal from this particular price range will drag prices near till 8900 levels over short term” Prices made a high of 9584 which was just a spike and reversed before that it made a low of 9047. From hourly analysis, the index is moving in a falling channel (marked with shade portion), it is imperative for prices to break the level of 9040 for further downside to sustain, my previous level of 8900 is still intact as it is likely to test it. After that the next level which the index is expected to achieve will be 8750. As per wave theory, Nifty has completed wave b of wave b and is now on the brink to start wave c lower which can go till 8900 followed by 8750 levels. The summation is, only a move below 9040 will infuse selling pressure which can accelerate the downtrend till above mentioned level