Posts

USDINR: Expected to surge

Image
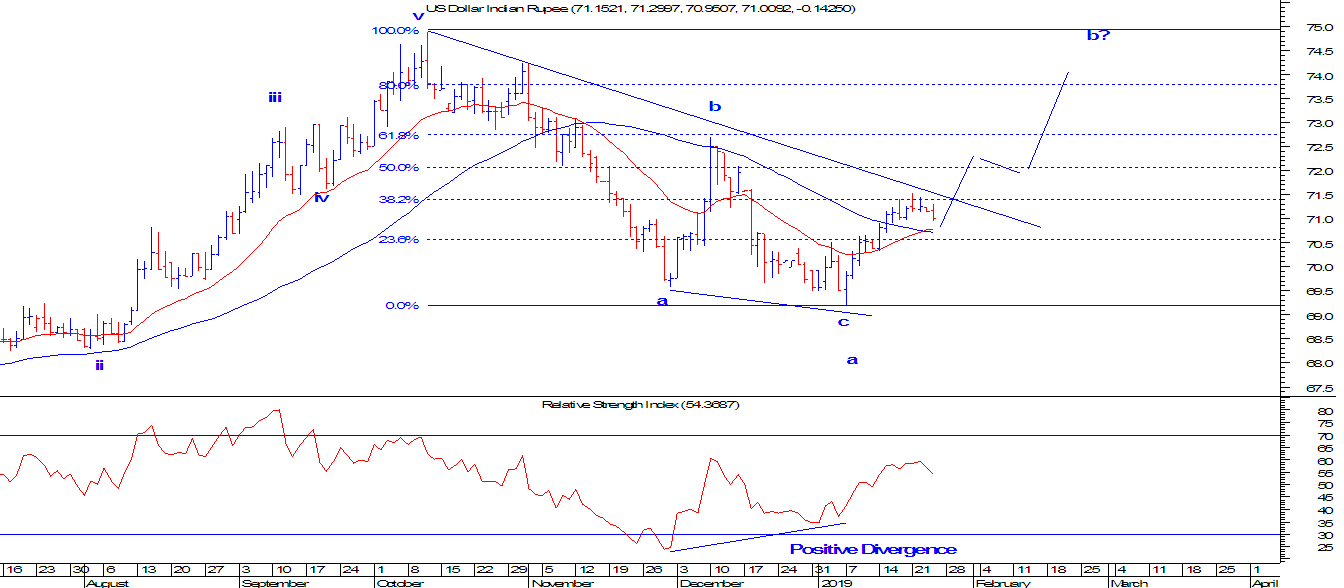
USDINR Daily Continuous chart USDINR is currently hovering near the resistance of the falling trend line. However, the short term moving averages have given a bullish crossover after two months from its previous crossover. It is important for prices to move above 71.50 levels for further positive possibilities which can push prices higher. Any sustainable move above 71.5 will make price surge near till 80% of the previous fall which is placed at 73.6 levels. RSI has exhibited positive divergence. Wave theory suggests that, prices might have completed wave a in three wave structure (a-b-c) at 69.2 and is now moving higher in wave b which can be close to the above mentioned level. In short, USDINR will surge till 73.6 levels over short to medium term once the level of 71.5 is taken out decisively. After 71.5 is crossed the support will be placed at 70.90 level. Learn Elliott Wave and Neo Wave to forecast prices in various asset classes. Subscribe to a two day paid on

ICICI Bank: Ending Diagonal Pattern

Image
ICICI Bank Daily Chart ICICI bank is currently moving in a wedge pattern. Wedge pattern is normally a reversal pattern. However, in ICICI Bank it seems that minor leg on the upside is pending. This minor swing can surge till 390-392 levels where the resistance of wedge is placed. As per wave theory, this overlapping structure is termed as a ending diagonal pattern. The last leg wave v is still ongoing. After completing wave v, a dynamic move is expected which can make price tumble near till 330 levels which is near the support of wave iv. Conclusion, prices can move in between 390-400 levels. However, this move will not be sustainable which will eventually make price falter till 330 levels over medium term. Learn Elliott Wave and Neo Wave to forecast prices in various asset classes. Subscribe to a two day paid online webinar which will help you to learn in dept analysis of price along with time. The price for the webinar will be 10000/- for two days. To book the seats

Bank Nifty: Impulse on the way?

Image
Bank Nifty (Daily Chart) Bank Nifty witnessed a counter trend after a steep fall last year. However, the current counter trend is on the brink to complete. The trend has arrived near 80% retracement of the previous fall (28388-24240), It is also been observed that a bearish pattern is in making near the resistance. RSI on daily is exhibiting negative divergence. As per wave theory, I have marked wave a at 24240 and wave b which is on going. In wave wave b, which is a three wave structure (a-b-c) within which we can see ending diagonal pattern, occurring in wave c of wave b. Completion of wave ii will open wave iii downside which will be steep and highly volatile. Conclusion: Prices are near resistance, a move below 26900 will start a steep move downside dragging it lower till 24000 and further lower. Learn Elliott Wave and Neo Wave to forecast prices in various asset classes. Subscribe to a two day paid online webinar which will help you to learn in dept analysis o

MCX Zinc: Completion of an impulse wave

Image
MCX Zinc (Daily Continuous Chart) MCX Zinc has completed five waves down which can be seen in the above chart. The third wave down has shown an extension which means that the subdivisions are clearly seen which is marked in a bracket. Wave v is truncated, that is it has failed to move down below wave iii. Prices have started moving higher as a new leg on the upside. As of now prices can move in between 180-185 levels followed by a correction which can be sideways to negative and again resumption of the trend will be seen which can surpass 200 levels.

Canara Bank: Change in trend?

Image
Canara Bank Daily Chart Canara Bank one of the PSU banks which saw some serious selling last year and current year but it seems that the selling pressure is likely to end and change in trend for this stock is likely. The fall from 440 till 216 was in an impulse fashion. I have marked (i,ii,iii,iv and v) ending at 216. The recent up move is also an impluse move and the marking is i and ii, indicating wave iii on the upside can start soon soaring prices till 330 levels. Two short term moving averages show a bullish crossover where 20 EMA (red) is above 50 SMA (blue) after almost nine months excluding the whipsaw. In short, the view is bullish for this PSU stock as it can surge till 330 where cluster of resistance is placed over short term. Learn Elliott Wave and Neo Wave to forecast prices in various asset classes. Subscribe to a two day paid online webinar which will help you to learn in dept analysis of price along with time. The price for the webinar will be 100

MCX Copper: Corrective mode

Image
MCX Copper Daily Continuous MCX Copper has started to plunge once it discontinued the higher high and higher low formation which eventually broke the rising channel as well. Prices recently made a low of 402 and turned its direction up till 434 levels. Interestingly, the up move was very slow and the weekly candle has formed a bearish candle. This indicates, that prices will fail to cross 439 levels and will turn down in coming week. As per wave theory, the red metal has formed a counter trend after the fall from the high of 493 to 402.  Now after completing wave i and wave ii on the downside, I am expecting prices will plummet near till 395-390 levels in form of wave iii. In short, the bias is firmly negative for Copper as it is expected to test 395-390 levels in near to medium term. Learn Elliott Wave and Neo Wave to forecast prices in various asset classes. Subscribe to a two day paid online webinar which will help you to learn in dept analysis of price along with t

Yes Bank: Irregular Flat pattern

Image
Yes Bank Daily chart From the above chart, Yes Bank is tumbling aggressively esp after discontinuing the higher high and higher low pattern, thus opening negative possibility. It is now likely that the stock is likely to fall further close to the Fibonacci levels. As per wave theory, I have marked wave A as a flat and wave B as a complex correction and as a whole A and wave B is an irregular flat pattern. So on the downside wave C has already started which can drag prices lower till 305 levels (100% of wave A to wave B). The bias is firmly negative for Yes Bank and can test the level of 305 in near term. Learn Elliott Wave and Neo Wave to forecast prices in various asset classes. Subscribe to a two day paid online webinar which will help you to learn in dept analysis of price along with time. The price for the webinar will be 10000/- for two days. To book the seats mail to meghmody@gmail.com