Posts

GBPINR Elliott Wave Analysis
Image
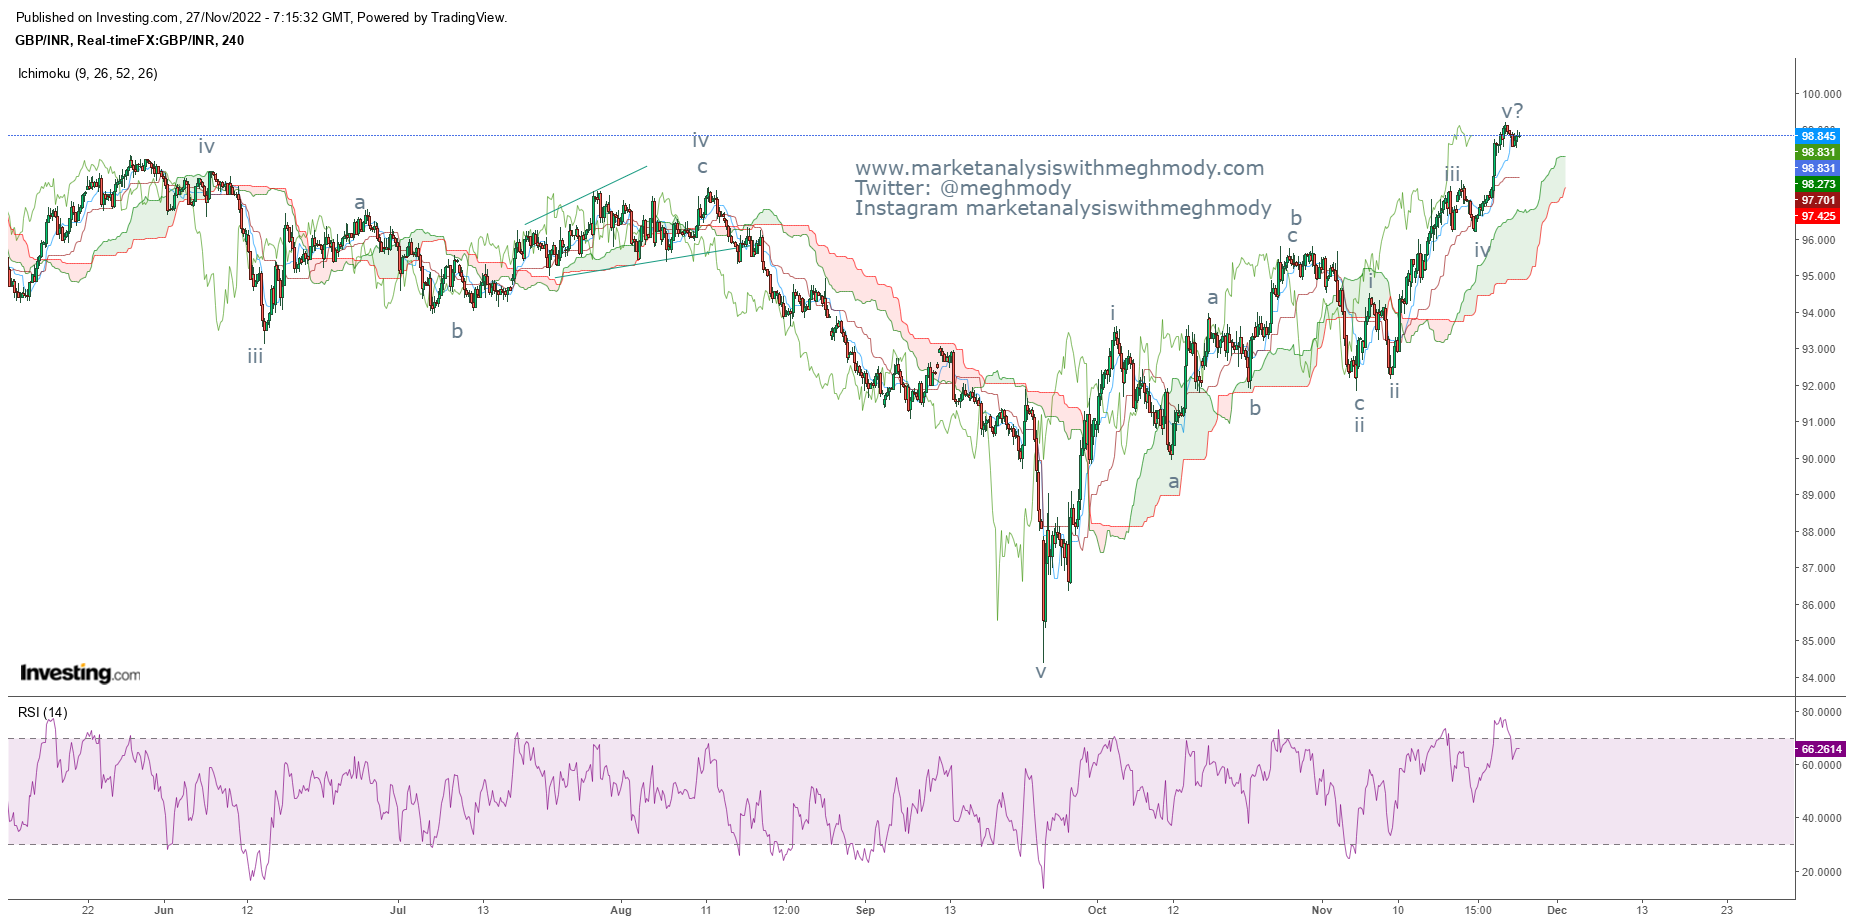
 GBPINR 4 hour spot chart Analysis As seen in the above chart, Cable continues to move in a positive direction and has picked up momentum much ahead of the political turmoil in UK. At present the pair has the tendency to move in a counter trend which will be more likely to be sideways to negative as RSI is also relieving from the overbought terrain. The Ichimoku cloud is poised at 98.3 levels where the pair can find support for the short term. As per wave theory, prices might have completed wave iii in five wave structure and now can retrace back for the iv wave to form. The support is at 98.30-38.25 levels which might complete wave iv followed by wave v. Any move back to 98.50-98.30 can be utilized as a buying opportunity. The summation is GBPINR can dip towards 98.50-98.3 range which is a buying opportunity as it can move till 99.50-99.8 levels over short to medium term.

MCX Gold Elliott Wave Analysis

Image
 MCX Gold hourly continuous chart Analysis From the above chart, MCX Gold has moved above the falling channel thus giving bullish break. The yellow metal has also started forming higher highs and higher lows thus discontinuing the negative formation. In the lower panel, MFI has started picking up from the oversold zone which will support the prices go gold going ahead. As per wave theory, gold is moving in wave c where it is on the brink to complete wave iv and open wave v which can push prices near till 53000-53200 levels. The summation is MCX Gold can soar till 53000-53200 levels over short term with support placed at 52030 (closing basis).

US 10 Year Yields and Elliott Wave Analysis

Image
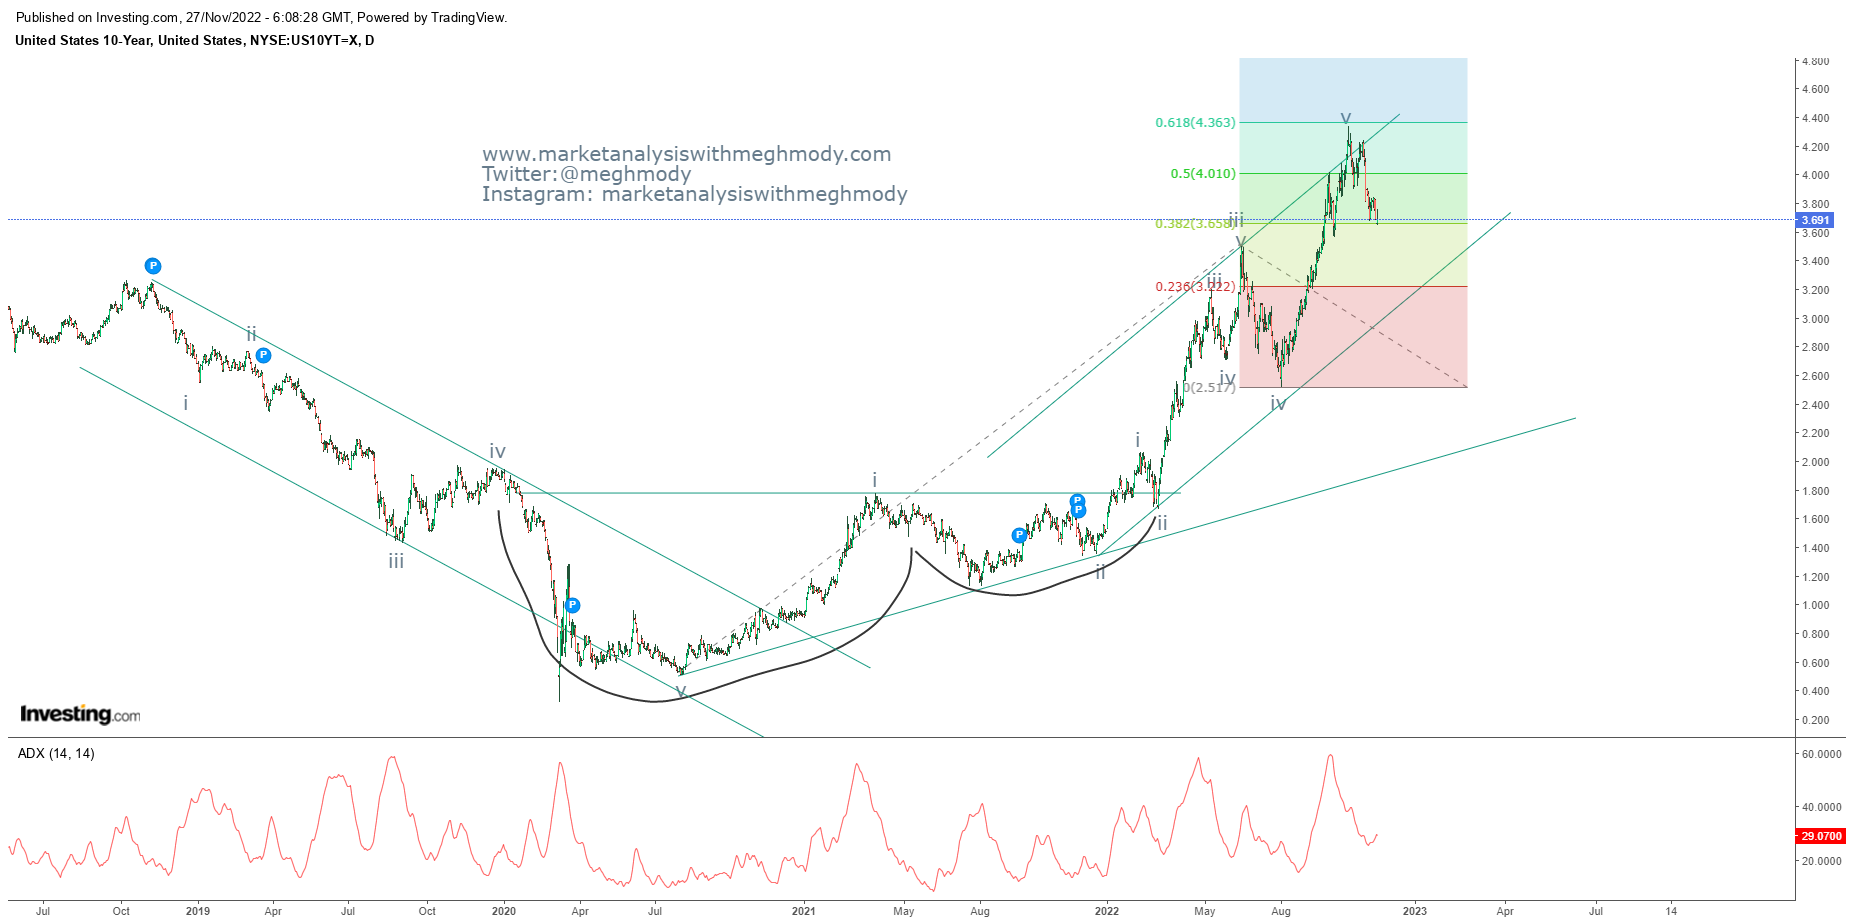
 US 10 Year Yield daily chart Analysis As shown in the above chart, US 10 year yield is moving in a higher highs and higher lows and it is precisely moving in a rising channel. Recently it faced the resistance of the channel and reversed, currently moving in a negative direction. It has also breached its previous low of 3.68%, thus opening further negative possibilities. A weak 10 year benchmark yield supports riskier assets indicating good inflows in global equities. The global equities has started picking up momentum in the last three weeks on the back of weak yields. ADX is also indicating that the strength of the upward trend has subsided. From Waves perspective, Wave v has ended at 61.8% from wave 0 to iii added to iv thus giving an indicating that the top has been in place. Prices are now moving in opposite direction and has opened wave a on the downside which can move down towards 3.55% The summation is US 10 Year Yield is negatively poised and can move down towards it

Nifty Elliott Wave Analysis

Image
 Nifty daily chart Nifty 2 hour chart Analysis From daily chart, the level of 18200 will act as a crucial support for the index, only a breach of this level will infuse selling pressure. Nifty is positively poised and can reach near till 18600 levels which I am saying from past three weeks now. The momentum has become slow which is a cause of concern as of now. ADX has started picking up strength which is a positive sign. In 2 hour chart, prices are moving in a 45 degree angle which opens the possibility of a rising wedge pattern. This pattern I was expecting last week also indicating that distribution has started and can move slowly move near to the all-time high of 18600 levels. RSI has started exhibiting negative divergence. As per Wave theory, Wave C is still ongoing and has opened wave v of wave c which looks to be in an ending diagonal. The summation is Nifty continues to move in a positive direction with support at 18200 and on the upside 18550-18600 will be the resistance

Nasdaq and Elliott Wave Analysis

Image
 Nasdaq daily chart Analysis As shown in the above chart, Nasdaq continues to slump in a lower highs and lower lows fashion. However, prices have shown resilience and has started moving higher which can move towards its immediate resistance which is the falling trend line. Daily RSI has vacuum to move higher to enter back in the overbought terrain. Currently it is above the center line which is positive sign. From Waves perspective, the index has completed wave a and has opened wave b after forming wave x higher, this clearly means that the benchmark is moving in a double correction (a-b-c-x-a-b-c). Currently it is on its way higher for wave b. The summation is Nasdaq can move higher to test the level of 11600 over short term with support placed at 10900 (closing basis).

MCX Crude Oil and Elliott Wave Analysis

Image
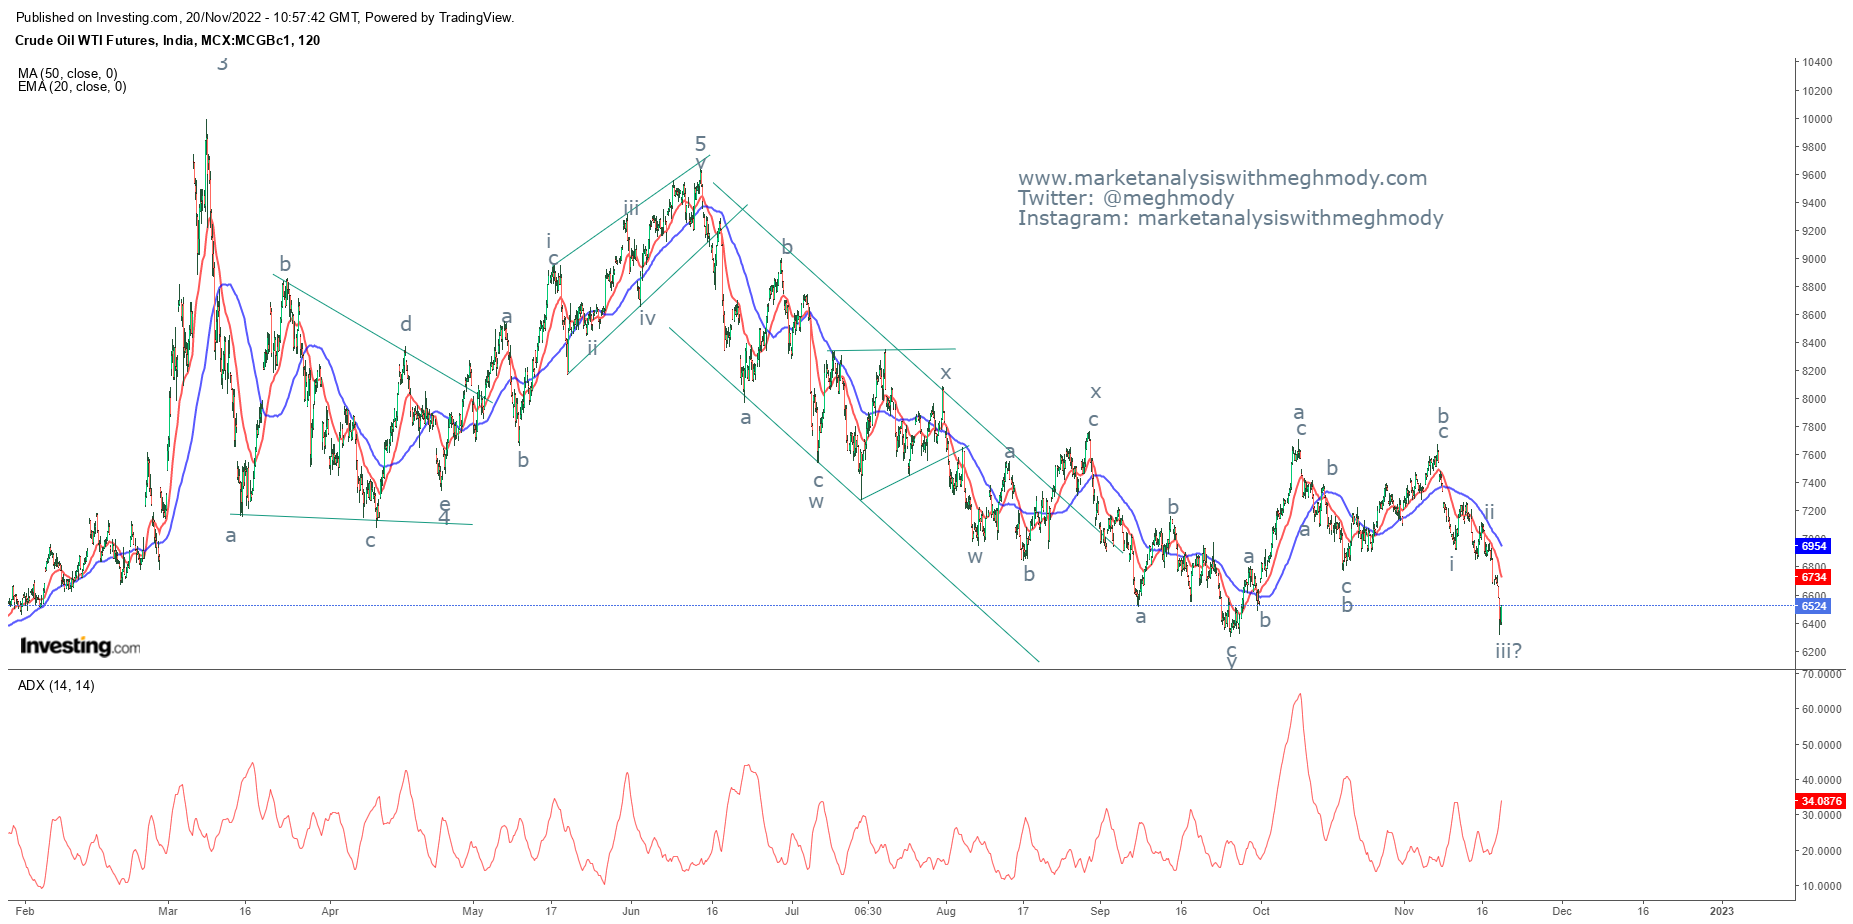
 MCX Crude Oil 2 hour continuous chart Analysis From the above chart, MCX Crude Oil has started moving in a lower highs and lower lows. Recently the low of 6524 marked on 26 th September 2022 was breached indicating that Crude Oil is in stealth bear trend. In the lower panel, it is very clear that ADX has picked up momentum has is above 30 levels suggesting that the downtrend is very strong. As per wave theory, prices have completed wave B in a flat pattern and has opened wave c lower which can go till 5637 followed by 5082 which is 61.8% and 78.6% from wave a to wave b. The summation is MCX Crude Oil is negatively poised and can move down towards 5637 levels over short term followed by 5082 over medium term with resistance placed at 6954 (intraday basis).

Dow Jones Industrial Average (DJIA) Elliott Wave Analysis

Image
  Dow Jones Industrial Average daily chart Analysis As shown in the above chart, DJIA has given a bullish break in a falling channel pattern which opens positive possibilities. Currently prices are trading above this pattern and has the tendency to re-test the support (earlier acting as resistance) which falls in a range of 32800-32400. From Waves perspective, the index is moving in an impulse fashion in which it has completed wave i and can start wave ii at one higher degree which can retrace 23.6%-38.2% which falls under 32400-32000 levels. This is the area where wave ii will be completed and then wave iii on the upside will start which can go till 36400 levels. The summation is DJIA has a good support of 32400-32000 levels which can be utilized as a buying opportunity for the level of 36400 levels over medium term.