Posts

Deepak Nitrite: Anticipated Happened

Image
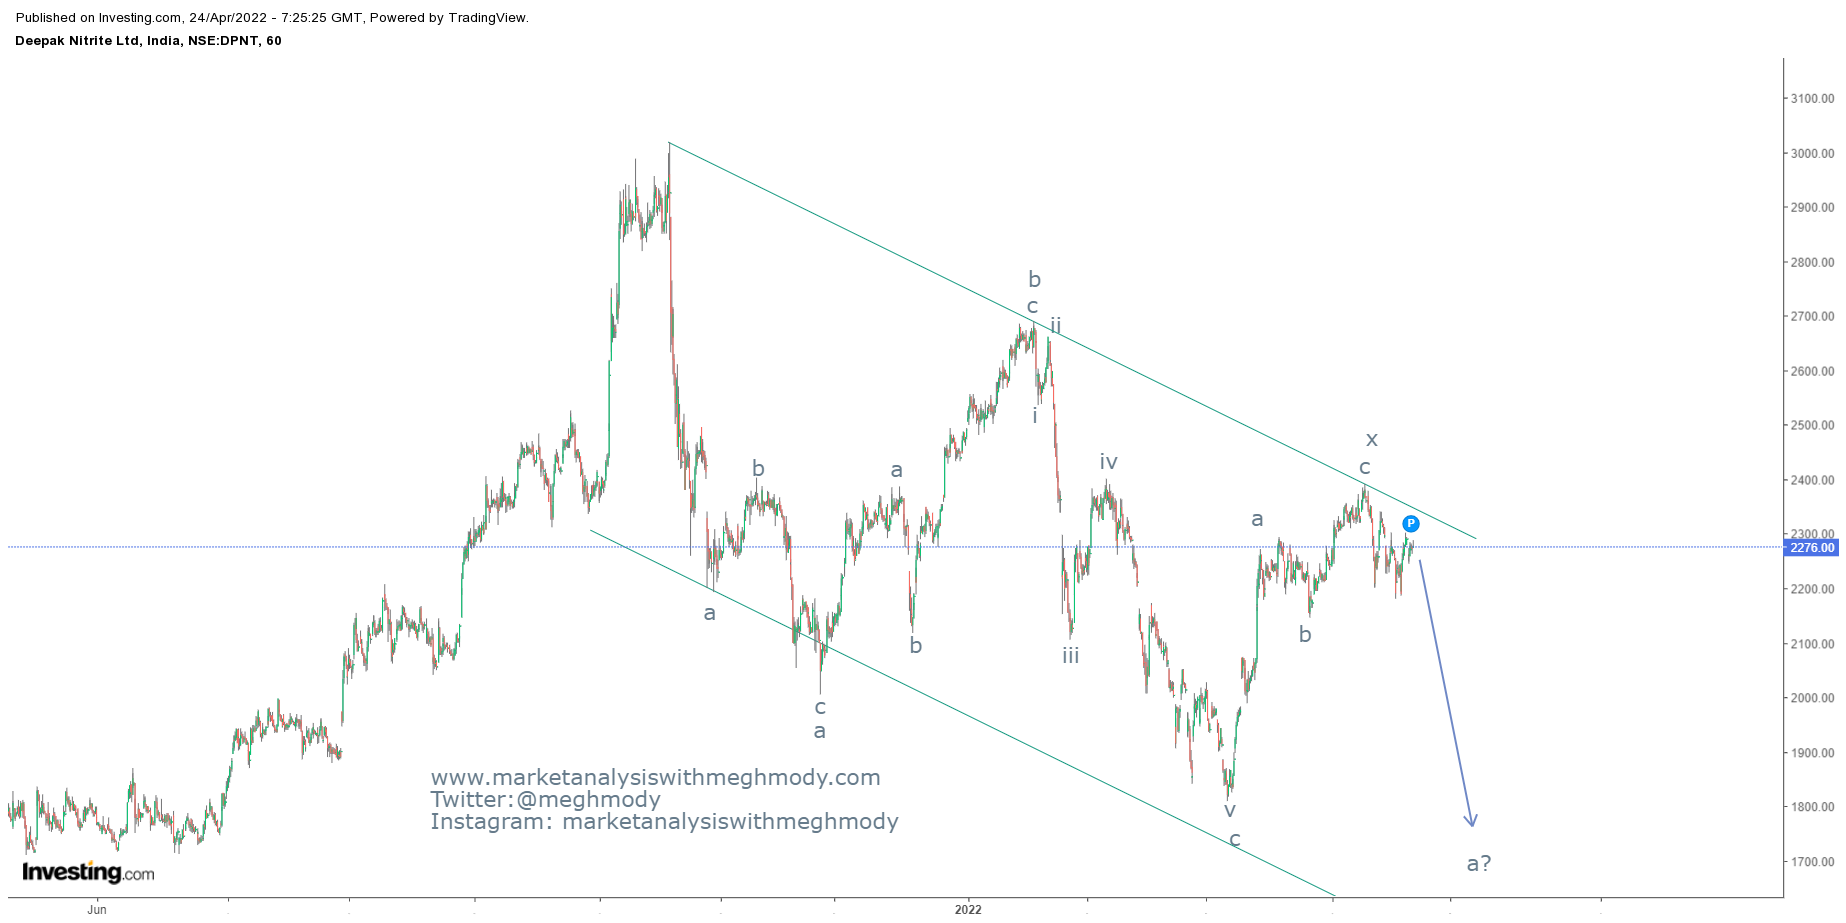
 Deepak Nitrite 60 mins chart anticipated on 24th April 2022 Deepak Nitrite 60 mins chart happened on 10th June 2022 In my previous article, I had reiterated, " Deepak Nitrite can sin to the level of 1800-1750 levels over short term with the resistance placed at 2400." The stock plunged below 1750 levels on 10th June 2022 thereby achieving my above mentioned levels - Anticipated Happened To view my previous article on Deepak Nitrite, click on the below mentioned link https://www.marketanalysiswithmeghmody.com/2022/04/deepak-nitrite-elliott-wave-analysis.html As per Wave theory, prices have either completed wave a after wave x in double correction or it has completed wave c of a normal correction (a-b-c). In both the scenarios there are chances for the stock to show a relief rally.

Nifty and the road ahead with Elliott Wave

Image
 Nifty daily chart As per the above chart, prices are moving in a lower highs and lower lows and it is precisely moving in a falling channel. The index is negatively poised on the back of various reasons, one of them is the rate hike by US FED.  Wave theory suggests that the index is suppose to falter below its recent low of 15730 and can reach towards 15450-15350 levels over short term. I earlier thought that wave a is corrective but it can also be impulse and that is why I believe that wave v of wave a can reach towards the support of the falling channel. The summation is Nifty can falter towards 15450-15350 range over short to medium term.

MCX Natural Gas: Elliott Wave Ending Diagonal

Image
 MCX Natural Gas 60 mins chart MCX Natural Gas has shown tremendous rally in past one year but it seems that the rally is poised for a breather, the reason being is a distribution pattern happening at the top. This distribution pattern in technical terms is known as rising wedge pattern. From Waves perspective, prices have completed five wave up (impulse) and it is all set to correct. In the fifth wave Nat Gas has formed ending diagonal pattern which concludes that the upside is on a halt and the likelihood of prices to falter is plausible. Prices are set to move back towards 520-500 levels where cluster of supports are placed including 0-2 line. The summation is MCX Nat Gas is all set to plunge till 520-500 levels over short to medium term.

MCX COPPER Anticipated Happened

Image
MCX COPPER 60 mins chart anticipated on 17th May 2022 MCX COPPER 60 mins chart happened on 2nd June 2022 In my previous article on MCX COPPER, I had mentioned that, " MCX COPPER will surge till 790-795 levels over short term." The red metal tested the resistance as mentioned above thereby achievingy levels - Anticipated Happened. To view my previous article on MCX COPPER, click on the below link https://www.marketanalysiswithmeghmody.com/2022/05/mcx-copper-elliott-wave-analysis.html

Tata Steel: Anticipated Happened

Image
 Tata Steel 60 mins chart anticipated on 13th April 2022 Tata Steel 60 mins chart happened on 23rd May 2022 In my previous update in Tata Steel, I had mentioned that, " Tata Steel is negatively poised and can plunge near till 1070 levels over short term." The stock plunged below the crucial support of 1070 thereby achieving my mentioned level of 1070, gaining 19.36% - Anticipated Happened To view my previous article on Tata Steel, click on the below link https://www.marketanalysiswithmeghmody.com/2022/04/tata-steel-elliott-wave-analysis.html Tata Steel has technically broken crucial supports and it is in stealth downdrend now, any rise can be utilized as a selling opportunity. From waves perspective, either five waves are over or third wave is extended, I believe in the latter one which will open further downside in this metal stock. The summation is Tata Steel will continue to dip an can reach 820-800 levels over very short term.

MCX COPPER Elliott Wave Analysis

Image
MCX COPPER 60 mins chart MCX COPPER is in downtrend as it persists in falling channel. However, the red metal has shown resilience from the support of the channel where it gave a bullish break in falling wedge pattern. As per Wave theory, prices completed corrective pattern (a-b-c) which was a simple zigzag. After ending diagonal pattern in the last leg of wave c prices can move up either in the form of wave x or a new high can be made. It is early to say that and so I have come to a conclusion that it will reach to the early resistance. The summation is MCX COPPER will surge till 790-795 levels over short term.

USDINR: Elliott Wave Analysis

Image
UADINR Daily chart As shown in the daily chart, prices are facing resistance of 138.2% of Fibonacci retracement 77 to 72.3. Also at the top, the pair has formed a distribution pattern which is rising wedge. However there is no bearish break confirmed by the price. From Waves perspective, prices are moving in a irregular flat pattern and has completed wave b. This will now start wave c lower plummeting it towards 75.5 levels. The summation is USDINR can reverse anytime soon plunging till 75.5 over medium term.